Time to Reevaluate Your Equity Allocation
As the S&P 500 has become an unprecedentedly narrow index in recent years, investors face a dilemma: Should they sit tight with this top-heavy index, or should they shift allocations?
While the S&P 500 comprises a broad set of companies, we think that taking a high conviction, highly selective approach focused on both Quality Growth mid and large cap companies as well as higher growth and more innovative Emerging Growth small cap companies could reward investors as the market likely broadens.
S&P 500 In Context
The S&P 500 includes 500 leading U.S. companies and covers roughly 80% of the U.S. market capitalization of public equities. Its diversification and quality factors have historically made it a standard for core equity allocation.
However, the current level of narrowness in the S&P 500 is at unprecedented levels. According to Reuters, “concentration within the U.S. equity market has not been this high in decades, with the 10 largest U.S. stocks now accounting for 33% of S&P 500 market cap. A narrower measure constructed by analysts at Goldman Sachs shows that market concentration has never been higher."1
The Magnificent 7 (Apple, Amazon, Alphabet, Meta, Microsoft, Nvidia, and Tesla) alone comprise nearly 30% of the S&P 500 market capitalization. As we have written in the past, the Magnificent 7 in aggregate represent a strong set of businesses, so the concentration is not completely without merit. In fact, from a growth, profitability, and balance sheet perspective, the Magnificent 7 far outshine the broader S&P 500. Given these fundamentals, the valuation premium of the Magnificent 7 does not appear unreasonable in aggregate. However, some members of the Magnificent 7 trade at extremely high valuations, especially relative to stagnating profitability, growth, and returns on capital. Ultimately, valuation must reflect fundamentals.
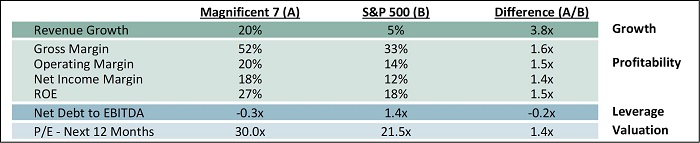
Note that revenue growth is projected for 2024 vs. 2023 actual results, while margins/ROE/net debt to EBITDA reflect 2023 actual results.
Source: Bloomberg (as of 3/14/2024).
Perhaps, more importantly than valuation as a risk, competitive threats and execution issues could dethrone one or more of the companies that are so important to the index today. Just ten years ago the top ten companies in the S&P 500 included Chevron and Wells Fargo, neither of which is even in the top 20 today. And 20 years ago, Pfizer, Citigroup, GE, Intel, Cisco, and IBM counted among the top ten companies of the S&P 500. Not one of those is in the top 20 today.
Furthermore, a recent study by Goldman Sachs2 found that buying and holding the top ten stocks in the S&P 500 generally produced negative relative returns vs. the S&P 500. Since 1980, these top ten stocks underperformed the S&P 500 by -2.0% and -2.3% annualized over the next three and five years, respectively. While the top ten companies are dominant, “faster companies come along and outperform … innovation tends to generate new technologies, products and markets; alongside these, stock market leadership also tends to change.”
As a result, the market broadens out over time, as valuation and fundamentals balance one another out. But in the short term, as reflected in the current top-heavy S&P 500, market returns can be highly concentrated.
Consider that over the past five years, the market cap-weighted S&P 500 has generated an annualized total return of roughly 15% vs. 12% for the S&P 500 Equal Weight Index. However, over longer periods of time, the market cap-weighted and equal weighted S&P 500 have generated roughly equivalent returns. If history is any guide, future returns should broaden beyond the largest components of the S&P 500 of today.
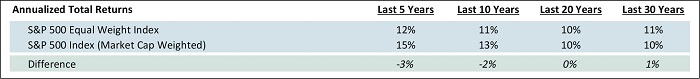
Source: RIMES as of 3/14/2024. Past performance does not guarantee future results.
Small Caps in Context
Historically, there has been a strong small cap premium, with small cap stocks outperforming large caps over long periods going back to 1926.
The outperformance of small caps could be explained by relatively lower market liquidity, better fundamental growth, and a higher risk premium. However, over the past five to ten years, small caps have underperformed large caps, coinciding with the rise of the Magnificent 7.
As a result, small caps now look undervalued vs. large caps on several measures, especially when considering a more stable interest rate environment. For example, an analysis by Jefferies found that small caps are now just 4% of the total U.S. equity market vs. previous highs approaching nearly 15%. This relative undervaluation for small caps at less than 5% of the market has historically been a catalyst for strong forward returns, with small caps outpacing large caps by 11.7%, 8.1%, and 7.7% over subsequent one-, three-, and five-year periods.
Where to From Here? A Two-Part Solution: Quality Growth and Emerging Growth Companies
We think that a high conviction portfolio of carefully selected Quality Growth mid and large cap companies purchased at attractive valuations can generate attractive future returns with the opportunity for better downside protection compared to the S&P 500. We also believe that owning a high conviction portfolio of Emerging Growth small cap companies that are fast-growing, highly innovative, and largely undiscovered could add further upside. These strategies should generate attractive returns in their own right but also broaden equity exposure beyond the top-heavy S&P 500.
Core Equity: A Quality Growth Approach to Mid/Large Cap Exposure
As Warren Buffett wrote in his 2023 annual letter to Berkshire shareholders, his success has been largely driven by owning “wonderful businesses purchased at fair prices.” Consistent with this view, we believe that owning a well-curated portfolio of Quality Growth companies purchased at attractive valuations should generate compelling returns over time, as strong business fundamentals — growing free cash flow per share with high and/or improving returns on capital — should be reflected in rising share prices and growing dividends. We define Quality Growth companies as excellent businesses with durable competitive advantages that have long runways for growth and strong management teams. Discipline around valuation is key because buying at attractive valuations can enable multiple expansion, further driving upside in returns.
We take a long-term view, typically underwriting returns over a three- to five-year holding period, but we have owned some companies for over a decade. Taking a long-term view allows excellent businesses to generate differentiated returns over time while also maximizing the opportunity to generate long-term rather than short-term capital gains (taxes on the former are far less costly than on the latter).
Our Core Equity portfolio is composed of 30-40 carefully selected Quality Growth mid and large cap companies, including some members of the Magnificent 7, that we purchased at attractive valuations and that we believe can deliver attractive returns over time.
Emerging Growth: A Valuation Sensitive Approach to Small Cap Growth Exposure
A distinguishing characteristic of the small cap universe is that it contains some of the youngest and most innovative public companies. As a result, these companies tend to be more disruptors than disrupted. Household names such as Netflix, Amazon, and Nvidia all started out as small caps. Our Emerging Growth strategy has owned several companies like these, well before they became mega cap behemoths. By constantly sifting through the small cap universe, we hope to identify the next set of transformational winners well before the broader market discovers them.
As we have previously written, our Emerging Growth strategy is singularly focused on identifying exceptional companies that have the potential to “graduate” to mid and large cap companies. Such businesses often benefit from two kinds of growth tailwinds: 1) strong innovation, which leads to growing market share/penetration and 2) secular market growth.
We believe that our sustained success investing in small caps can be attributed to four differentiators:
- Our consistent focus on smaller, emerging companies, including our immersion in the San Francisco/Bay Area innovation ecosystem
- Leveraging our experience
- Staying disciplined in terms of valuation
- Investing only in our best ideas – 30 to 40 holdings
We believe both the intrinsic innovation characteristics in small caps and the current undervaluation relative to large caps make this a particularly opportune time to consider diversifying S&P-oriented exposure with small cap growth. Moreover, our four key differentiators have helped us generate consistently strong returns over time.
Conclusion
It is prudent for investors to consider diversifying away from an increasingly concentrated S&P 500. While the leaders of today are excellent companies in aggregate, valuation and competitive threats are concerns not to be ignored. History tells us that returns are likely to broaden, with the current level of market concentration unlikely to persist over time.
We think that shifting equity allocations to both Quality Growth mid and large cap companies as well as higher growth and more innovative Emerging Growth small cap companies could reward investors as the market likely broadens.
1Jamie McGeever, Reuters, “Peak US stock concentration doesn't mean steep drawdown, March 13, 2024”
2Peter Oppenheimer and others, Goldman Sachs, “The Concentration Conundrum; What to do about market dominance”
Nael Fakhry
Co-Chief Investment Officer – Core Equity
Bryan Wong, CFA
Vice President & Portfolio Manager - Small Cap Growth
Featuring


Nael Fakhry
Co-Chief Investment Officer – Core Equity
Nael Fakhry, a partner at Osterweis, is a Co-Lead Portfolio Manager for the core equity, growth & income, quality cyclical growth, and flexible balanced strategies. He loves the process of researching companies and studying the history of various industries.
Prior to joining Osterweis Capital Management in 2011, Nael worked as an Associate at American Securities, a private equity firm, and as an Analyst in the investment banking division of Morgan Stanley.
Nael graduated from Stanford University with a B.A. in History, Phi Beta Kappa and the University of California Berkeley, Walter A. Haas School of Business with an M.B.A., where he was a C.J. White Scholar. Outside of his professional life, Nael enjoys coaching his kids’ soccer and basketball teams, reading, and running.

Bryan Wong, CFA
Vice President & Portfolio Manager - Small Cap Growth
Bryan Wong, a partner at Osterweis, is a Portfolio Manager for the small cap growth strategy. His likes the pursuit of uncovering hidden gems, which have the opportunity to deliver strong, durable performance so our clients can achieve their long-term objectives. Bryan enjoys investing in small companies, because it is a creative process where it is possible to gain a true edge.
Prior to joining Osterweis Capital Management in 2014, Bryan was a member of the investment team managing the endowment of the David and Lucile Packard Foundation. Before that, he was an Analyst at Wohl Capital Management, a long/short hedge fund.
Bryan graduated from Yale University with a B.A. in Political Science and International Studies with distinction and from the University of California Berkeley, Haas School of Business, with an M.B.A., where he was an Investment Management Fellow. He holds the CFA designation and is a member of the CFA Society of San Francisco. Bryan also serves on the investment committee of the Asian Pacific Fund. Outside of work, he enjoys spending time with family and swimming.
For more information about this strategy, please send us an email or call us at (800) 700-3316.
Osterweis Fund Quarter-End Performance (as of 3/31/25)
| Fund | 1 MO | QTD | YTD | 1 YR | 3 YR | 5 YR | 10 YR | 15 YR | 20 YR |
INCEP (10/1/1993) |
|---|---|---|---|---|---|---|---|---|---|---|
| OSTFX | -4.39% | -3.27% | -3.27% | -0.33% | 4.38% | 12.99% | 7.46% | 8.84% | 7.61% | 10.07% |
| S&P 500 Index | -5.63% | -4.27% | -4.27% | 8.25% | 9.06% | 18.59% | 12.50% | 13.15% | 10.23% | 10.33% |
Gross expense ratio as of 3/31/24: 0.96%
Performance data quoted represent past performance; past performance does not guarantee future results. The investment return and principal value of an investment will fluctuate so that an investor’s shares, when redeemed, may be worth more or less than their original cost. Current performance of the Fund may be higher or lower than the performance quoted. Performance data current to the most recent month end may be obtained by calling shareholder services toll free at (866) 236-0050.
Rates of return for periods greater than one year are annualized.
Where applicable, charts illustrating the performance of a hypothetical $10,000 investment made at a Fund’s inception assume the reinvestment of dividends and capital gains, but do not reflect the effect of any applicable sales charge or redemption fees. Such charts do not imply any future performance. During the period noted, fee waivers or expense reimbursements were in effect for the Osterweis Fund.
The S&P 500 Index is widely regarded as the standard for measuring large cap U.S. stock market performance. The index does not incur expenses, is not available for investment, and includes the reinvestment of dividends.
References to specific companies, market sectors, or investment themes herein do not constitute recommendations to buy or sell any particular securities.
There can be no assurance that any specific security, strategy, or product referenced directly or indirectly in this commentary will be profitable in the future or suitable for your financial circumstances. Due to various factors, including changes to market conditions and/or applicable laws, this content may no longer reflect our current advice or opinion. You should not assume any discussion or information contained herein serves as the receipt of, or as a substitute for, personalized investment advice from Osterweis Capital Management.
Complete holdings of all Osterweis mutual funds (“Funds”) are generally available ten business days following quarter end. Holdings and sector allocations may change at any time due to ongoing portfolio management. Fund holdings as of the most recent quarter end are available here: Osterweis Fund
Opportunity Fund Quarter-End Performance (as of 3/31/25)
| Fund | 1 MO | QTD | YTD | 1 YR | 3 YR | 5 YR | 10 YR |
INCEP (10/1/2012) |
|---|---|---|---|---|---|---|---|---|
| OSTGX | -7.77% | -14.87% | -14.87% | -6.98% | 1.81% | 13.87% | 11.06% | 12.75% |
| Russell 2000 Growth Index | -7.58% | -11.12% | -11.12% | -4.86% | 0.78% | 10.78% | 6.14% | 9.00% |
Gross/Net expense ratio as of 3/31/24:1.20% / 1.12%. The Adviser has contractually agreed to waive certain fees through June 30, 2025. The net expense ratio is applicable to investors.
Performance data quoted represent past performance; past performance does not guarantee future results. The investment return and principal value of an investment will fluctuate so that an investor’s shares, when redeemed, may be worth more or less than their original cost. Current performance of the Fund may be higher or lower than the performance quoted. Performance data current to the most recent month end may be obtained by calling shareholder services toll free at (866) 236-0050. Performance prior to December 1, 2016 is that of another investment vehicle (the “Predecessor Fund”) before the commencement of the Fund’s operations. The Predecessor Fund was converted into the Fund on November 30, 2016. The Predecessor Fund’s performance shown includes the deduction of the Predecessor Fund’s actual operating expenses. In addition, the Predecessor Fund’s performance shown has been recalculated using the management fee that applies to the Fund, which has the effect of reducing the Predecessor Fund’s performance. The Predecessor Fund was not a registered mutual fund and so was not subject to the same operating expenses or investment and tax restrictions as the Fund. If it had been, the Predecessor Fund’s performance may have been lower.
Rates of return for periods greater than one year are annualized.
Where applicable, charts illustrating the performance of a hypothetical $10,000 investment made at a Fund’s inception assume the reinvestment of dividends and capital gains, but do not reflect the effect of any applicable sales charge or redemption fees. Such charts do not imply any future performance.
The Russell 2000 Growth Index (Russell 2000G) is a market-capitalization-weighted index representing the small cap growth segment of U.S. equities. This index does not incur expenses, is not available for investment and includes the reinvestment of dividends.
References to specific companies, market sectors, or investment themes herein do not constitute recommendations to buy or sell any particular securities.
There can be no assurance that any specific security, strategy, or product referenced directly or indirectly in this commentary will be profitable in the future or suitable for your financial circumstances. Due to various factors, including changes to market conditions and/or applicable laws, this content may no longer reflect our current advice or opinion. You should not assume any discussion or information contained herein serves as the receipt of, or as a substitute for, personalized investment advice from Osterweis Capital Management.
Complete holdings of all Osterweis mutual funds (“Funds”) are generally available ten business days following quarter end. Holdings and sector allocations may change at any time due to ongoing portfolio management. Fund holdings as of the most recent quarter end are available here: Opportunity Fund
The S&P 500 Equal Weight Index is an unmanaged index composed of the stocks held in the S&P 500 Index using an equal-weighted approach instead of market cap-weighted.
As of 12/31/23, the Osterweis Fund held positions in Amazon, Alphabet, and Microsoft. The Osterweis Emerging Opportunity Fund does not hold positions in Apple, Amazon, Alphabet, Meta, Microsoft, Nvidia, or Tesla.
Gross profit margin is revenue, less the cost of goods sold (COGS), divided by revenue.
Operating profit margin is calculated by dividing a company’s net income (excluding interest, taxes, and other non-operating costs) by its net sales.
Net profit margin is net income (after COGS, operating expenses, interest, taxes, and other non-operating costs), divided by revenue.
The net debt-to-EBITDA (earnings before interest depreciation and amortization) ratio is a measurement of leverage, calculated as a company’s interest-bearing liabilities minus cash or cash equivalents, divided by its EBITDA.
Price-to-Earnings (P/E) Ratio is the ratio of a company’s stock price to its 12 months’ earnings per share.
Return on equity (ROE) is the amount of net income as a percentage of shareholders’ equity.
Mutual fund investing involves risk. Principal loss is possible.
The Osterweis Fund may invest in medium and smaller sized companies, which involve additional risks such as limited liquidity and greater volatility. The Fund may invest in foreign and emerging market securities, which involve greater volatility and political, economic and currency risks and differences in accounting methods. These risks may increase for emerging markets. The Fund may invest in Master Limited Partnerships, which involve risk related to energy prices, demand and changes in tax code. The Fund may invest in debt securities that are un-rated or rated below investment grade. Lower-rated securities may present an increased possibility of default, price volatility or illiquidity compared to higher-rated securities. Investments in debt securities typically decrease in value when interest rates rise. This risk is usually greater for longer-term debt securities.
The Osterweis Opportunity Fund may invest in unseasoned companies, which involve additional risks such as abrupt or erratic price movements. The Fund may invest in small and mid-sized companies, which may involve greater volatility than large-sized companies. The Fund may invest in IPOs and unseasoned companies that are in the early stages of their development and may pose more risk compared to more established companies. The Fund may invest in ETFs, which involve risks that do not apply to conventional funds. Higher turnover rates may result in increased transaction costs, which could impact performance. From time to time, the Fund may have concentrated positions in one or more sectors subjecting the Fund to sector emphasis risk. The Fund may invest in foreign and emerging market securities, which involve greater volatility and political, economic and currency risks and differences in accounting methods. These risks may increase for emerging markets.
The Osterweis Funds are available by prospectus only. The Funds’ investment objectives, risks, charges, and expenses must be considered carefully before investing. The summary and statutory prospectuses contain this and other important information about the Funds. You may obtain a summary or statutory prospectus by calling toll free at (866) 236-0050, or by visiting www.osterweis.com/statpro. Please read the prospectus carefully before investing to ensure the Fund is appropriate for your goals and risk tolerance.
Osterweis Capital Management is the adviser to the Osterweis Funds, which are distributed by Quasar Distributors, LLC. [OCMI-521720-2024-04-03]
