Overview
Investment Objective
The Fund seeks long-term capital appreciation.
Investment Strategy
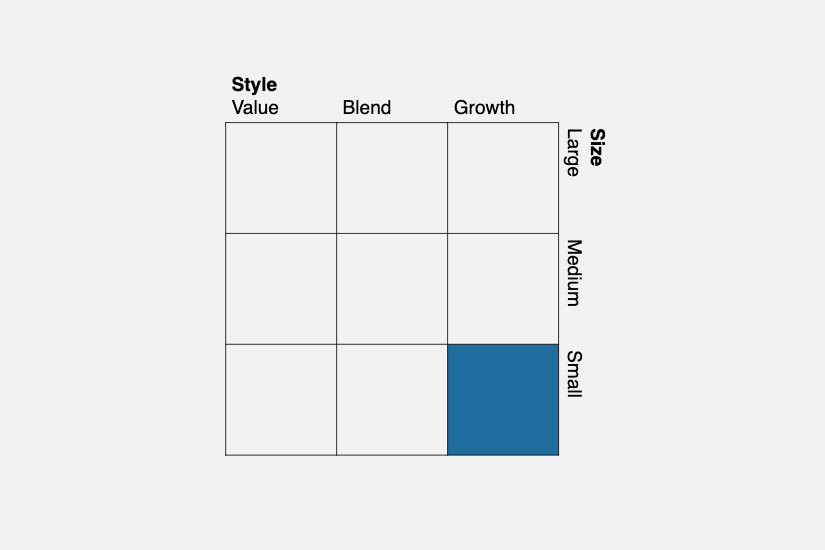
The Osterweis Opportunity Fund is a small cap growth mutual fund that invests primarily in companies that our investment team believes are likely to experience strong revenue growth and rising profitability.
Our approach is based on the following principles:
- Build a high conviction portfolio of quality companies
- Focus on innovative, emerging businesses with differentiated product offerings
- Invest in companies experiencing strong secular growth
- Maintain strict valuation discipline to help manage risk
- Invest in only our best ideas
- Leverage decades of investment experience
NAV as of 7/17/26
| Price | $20.96 | Change | $-0.13 |
|---|
Fund Facts
| Ticker | OSTGX |
|---|---|
| CUSIP | 74316P744 |
| Inception Date | 10/1/2012 |
|
Net Assets (as of 6/30/26) |
$383 million |
| Active Share (as of 6/30/26) | 95% |
| Number of Equity Holdings | 43 |
Fund Documents
| Document | Date |
|---|---|
| Fact Sheet | Jun 2026 |
| Summary Prospectus | Jun 2026 |
Explore our mutual fund options and start your investment journey.
Invest With UsInvestment Team


Performance
Performance
as of 6/30/26
| Fund | 1 MO | QTD | YTD | 1 YR | 3 YR | 5 YR | 10 YR |
INCEP (10/1/2012) |
|---|---|---|---|---|---|---|---|---|
| OSTGX | 12.44% | 35.34% | 30.22% | 41.37% | 18.23% | 5.05% | 16.63% | 15.05% |
| Russell 2000 Growth Index | 3.55% | 25.71% | 22.18% | 38.74% | 18.44% | 5.57% | 11.97% | 11.67% |
Gross/Net expense ratio as of 3/31/26: 1.22% / 1.12%. The Adviser has contractually agreed to waive certain fees through June 30, 2027. The net expense ratio is applicable to investors.
Performance data quoted represent past performance; past performance does not guarantee future results. The investment return and principal value of an investment will fluctuate so that an investor’s shares, when redeemed, may be worth more or less than their original cost. Current performance of the Fund may be higher or lower than the performance quoted. Performance data current to the most recent month end may be obtained by calling shareholder services toll free at (866) 236-0050. Performance prior to December 1, 2016 is that of another investment vehicle (the “Predecessor Fund”) before the commencement of the Fund’s operations. The Predecessor Fund was converted into the Fund on November 30, 2016. The Predecessor Fund’s performance shown includes the deduction of the Predecessor Fund’s actual operating expenses. In addition, the Predecessor Fund’s performance shown has been recalculated using the management fee that applies to the Fund, which has the effect of reducing the Predecessor Fund’s performance. The Predecessor Fund was not a registered mutual fund and so was not subject to the same operating expenses or investment and tax restrictions as the Fund. If it had been, the Predecessor Fund’s performance may have been lower.
Rates of return for periods greater than one year are annualized.
Hypothetical Growth of $10,000 Since Inception to 6/30/2026
(Dividends Reinvested)
(Dividends Reinvested)
Calendar Year Performance
| Date | OSTGX | Russell 2000 Growth |
|---|---|---|
| 2026 YTD (as of 6/30/26) | 30.22% | 22.18% |
| 2025 | 0.27% | 13.01% |
| 2024 | 22.48% | 15.15% |
| 2023 | 23.98% | 18.66% |
| 2022 | -33.00% | -26.36% |
| 2021 | 3.95% | 2.83% |
| 2020 | 83.24% | 34.63% |
| 2019 | 28.03% | 28.48% |
| 2018 | 1.64% | -9.31% |
| 2017 | 26.44% | 22.17% |
Portfolio Overview as of 6/30/2026
Asset Allocation % of Total Portfolio
| Category | Value | |
|---|---|---|
| Equities | 94.1% | |
| Cash & Equivalents | 5.9% |
Market Cap Characteristics Equities Only
| Characteristic | OSTGX |
|---|---|
| Weighted Average Market Cap | $9.9 billion |
| Median Market Cap | $6.6 billion |
Sector Exposure % of Equities
| Category | Value | |
|---|---|---|
| Health Care | 27.99% | |
| Information Technology | 23.95% | |
| Industrials | 23.34% | |
| Consumer Discretionary | 11.22% | |
| Financials | 9.37% | |
| Real Estate | 2.76% | |
| Consumer Staples | 1.37% |
Market Cap Exposure % of Equities
| Category | Value | |
|---|---|---|
| Less than $400 million | 0.0% | |
| $400 million - 750 million | 0.0% | |
| $750 million - 1.5 billion | 9.9% | |
| $1.5 - 7.5 billion | 44.7% | |
| $7.5 - 15 billion | 20.8% | |
| $15 billion - 50 billion | 24.6% | |
| Greater than $50 billion | 0.0% |
Top 10 Holdings % of Portfolio Excluding Cash & Equivalents
| Holding | Value |
|---|---|
| Vericel Corp | 3.5% |
| Life Time Group Holdings Inc | 3.5% |
| SPX Technologies Inc | 3.5% |
| Novanta Inc | 3.4% |
| Cardinal Infrastructure Group Inc-Class A | 3.4% |
| Twilio Inc-Class A | 3.3% |
| VSE Corp | 3.3% |
| Axos Financial Inc | 3.2% |
| Loar Holdings Inc | 3.0% |
| Repligen Corp | 3.0% |
| Total | 33.1% |
Complete holdings are generally available ten business days following quarter end.
The Osterweis Opportunity Fund’s holdings and sector allocations may change at any time due to ongoing portfolio management. References to specific investments should not be construed as a recommendation to buy or sell the securities by the Fund or Osterweis Capital Management.
Fiscal Year Turnover
| Year Ended March 31 |
Turnover |
|---|---|
| 2026 | 178% |
| 2025 | 137% |
| 2024 | 110% |
| 2023 | 124% |
| 2022 | 133% |
| 2021 | 111% |
| 2020 | 213% |
| 2019 | 215% |
| 2018 | 208% |
| 2017 | 217% |
Figures for 2013-2018 have been updated.
10/1/2012 to 3/31/2013
Sources: US Bank, Osterweis Capital Management, Conifer Financial Services
Fees & Distributions
Distribution Schedule
The Osterweis Opportunity Fund distributes income and capital gains once a year in December.
| Record Date | Ex./Pay and Reinvest Date | |
|---|---|---|
| Annual Income & Cap. Gains Distribution | 12/14/26 | 12/15/26 |
Recent Distribution History
| EX./PAY AND REINVEST DATE | ORDINARY INCOME | SHORT-TERM CAP. GAINS | LONG-TERM CAP. GAINS | TOTAL DISTRIBUTION | REINVEST NAV |
|---|---|---|---|---|---|
| 12/15/25 | $0.00000 | $0.00000 | $0.39124 | $0.39124 | 17.16 |
| 12/16/24 | $0.00000 | $0.00000 | $0.14462 | $0.14462 | 18.20 |
| 12/15/23 | $0.00000 | $0.00000 | $0.00000 | $0.00000 | 13.89 |
| 12/15/22 | $0.00000 | $0.00000 | $0.00000 | $0.00000 | 11.62 |
| 12/15/21 | $0.00000 | $1.79020 | $1.88859 | $3.67879 | 16.60 |
| 12/15/20 | $0.00000 | $1.72157 | $0.39862 | $2.12019 | 19.90 |
Insights

Literature
| Document | Date |
|---|---|
| Fact Sheet | June 2026 |
| OSTGX Shareholder Letter | April 2026 |
| Summary Prospectus | June 2026 |
| Statutory Prospectus | June 2026 |
| Document | Date |
|---|---|
| Statement of Additional Information | June 2025 |
| Annual Report | March 2026 |
| Semi-Annual Report | September 2025 |
The Adviser has contractually agreed to waive certain fees through June 30, 2026. The net expense ratio is applicable to investors.
Where applicable, charts illustrating the performance of a hypothetical $10,000 investment made at a Fund’s inception assume the reinvestment of dividends and capital gains, but do not reflect the effect of any applicable sales charge or redemption fees. Such charts do not imply any future performance.
The Russell 2000 Growth Index (Russell 2000G) is a market-capitalization-weighted index representing the small cap growth segment of U.S. equities. This index does not incur expenses and is not available for investment. This index includes reinvestment of dividends and/or interest.
Certain portfolio data may be available as of month-end. To make a request, please email us.
Past performance does not guarantee future results.
The Osterweis Funds are available by prospectus only. The Funds’ investment objectives, risks, charges, and expenses must be considered carefully before investing. The summary and statutory prospectuses contain this and other important information about the Funds. You may obtain a summary or statutory prospectus by calling toll free at (866) 236-0050, or by visiting www.osterweis.com/statpro. Please read the prospectus carefully before investing to ensure the Fund is appropriate for your goals and risk tolerance.
Mutual fund investing involves risk. Principal loss is possible.
The Osterweis Opportunity Fund may invest in unseasoned companies, which involve additional risks such as abrupt or erratic price movements. The Fund may invest in small and mid-sized companies, which may involve greater volatility than large-sized companies. The Fund may invest in IPOs and unseasoned companies that are in the early stages of their development and may pose more risk compared to more established companies. Higher turnover rates may result in increased transaction costs, which could impact performance. From time to time, the Fund may have concentrated positions in one or more sectors subjecting the Fund to sector emphasis risk. The Fund may invest in foreign and emerging market securities, which involve greater volatility and political, economic and currency risks and differences in accounting methods. These risks may increase for emerging markets.
While the fund is no-load, management fees and other expenses still apply. Please refer to the prospectus for more information.
Osterweis Capital Management is the adviser to the Osterweis Funds, which are distributed by Quasar Distributors, LLC.
