Higher Quality High Yield: Addition by Subtraction
Abstract
The credit quality of the high yield bond market has improved substantially since its inception, particularly after the Great Financial Crisis (GFC). In its early days, it was a clearinghouse for the riskiest publicly traded debt, but today over half the market is rated just one notch below investment grade.
In this paper, we explain that the transformation is primarily due to the exodus of weaker borrowers. Looking at several data sources, including agency ratings, spreads, and defaults, we show that since the GFC, higher quality sub-investment grade borrowers have favored the high yield market while the weakest borrowers have utilized the private credit market, which has been growing exponentially since 2009. The leveraged loan market tends to attract mid-quality borrowers.
We also examine fixed income returns and show that despite their improving credit profile and lower spreads, high yield bonds continue to deliver attractive performance.
We believe the structure of the fixed income market has permanently changed and that it now has four discrete tiers instead of two. High yield bonds were previously the lowest quality option, behind investment grade bonds. Post-GFC, they have become the second highest quality option, followed by leveraged loans, and finally private credit, which now appears to contain the highest concentration of low quality (“junk”) debt.
Has High Yield Become "Investment Grade-Light"?
Despite their attractive returns, investors have long held a skeptical view of high yield bonds. The perception likely dates back to the 1980s, when volatility and questionable credit metrics were the norm, and high-profile scandals dominated the headlines. First, the so-called Junk Bond King, Michael Milken, led Drexel Burnham Lambert into bankruptcy following securities fraud allegations. Then, a few years later, the Savings and Loan Crisis occurred, which was also partially blamed on bad investments in high yield bonds and dubious projects funded by the same.
As the saying goes, perception is reality, and today many investors still regard high yield as “too risky,” particularly for core fixed income allocations. However, since the GFC, the high yield market has undergone a significant upgrade in credit quality, and the majority of the market is now rated only one notch below investment grade debt.
The primary reason that credit quality has improved is that many weaker borrowers have exited the space and now obtain financing in the private credit and leveraged loan markets. In other words, there are not only more higher-quality issuers than there used to be, but there are fewer lower-quality issuers, so it has been a case of addition by subtraction.
Importantly, this trend shows no signs of abating, and we believe the structure of the high yield market has permanently changed. Fixed income markets previously had two primary tiers: investment grade and high yield. Now, there are four tiers: investment grade, high yield, leveraged loans, and private credit.
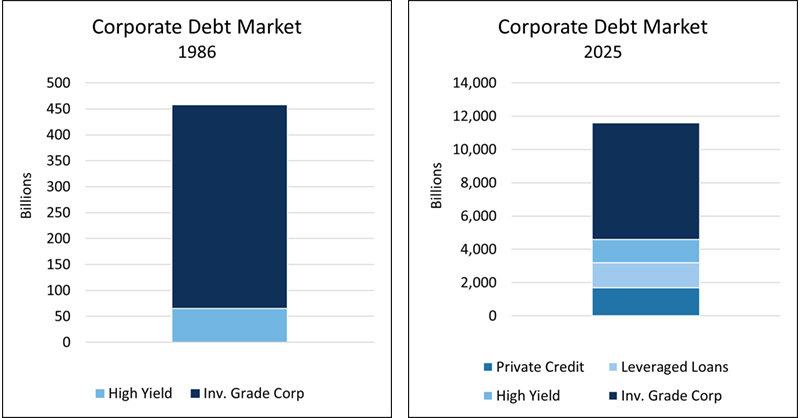
Source: ICE, Bloomberg U.S. Corporate Index, Moody's, JP Morgan
As a result, high yield has gone from being the lowest quality fixed income option to the second highest quality option, or as we are calling it, “Investment Grade-Light.” Moreover, similar to investment grade debt, the high yield market provides greater liquidity and transparency than either the loan or private credit market.
Private Credit, Loan Markets Have Grown Exponentially
The reason the fixed income markets have changed so much since the GFC is that in the aftermath of the crisis, regulators revised the rules to aggressively disincentivize big banks from making loans to lower-quality borrowers. They increased capital requirements to such high levels that lending at-scale became a practical impossibility.
Of course, the demand for financing did not stop, so nonbank lenders stepped in to fill the void. Leveraged loans became the primary option for mid-market borrowers and private equity backed leveraged buyouts (LBOs), both of which formerly relied on banks. The private credit market serviced a wider range of companies, including many lower quality and/or smaller borrowers that previously issued in the high yield market.
The chart below, published by the Federal Reserve, shows how the markets evolved from 2009 to mid-2023. Leveraged loans more than doubled during that period, though they started from a relatively low level as the market did not really begin trading actively until the mid-2000s. Private credit debt grew exponentially post-GFC, increasing from zero to almost $800 billion, while high yield issuance grew modestly and declined after 2020. In 2009, the high yield market was ~$200 billion larger than the other two markets combined. By June of 2023, it was roughly $1 trillion smaller.
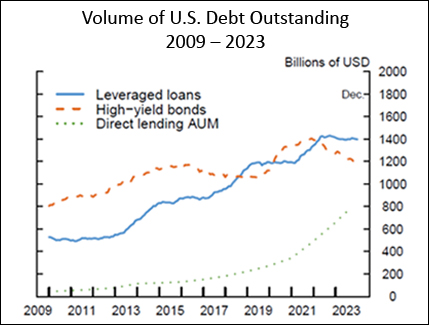
Source: Federal Reserve Board
Interestingly, private credit continues to expand at a much faster pace than either of the other two markets. As of mid-2025, the private market is estimated at $1.7 trillion (roughly 2x the size in mid-2023), and Moody’s Investors Services estimates the market could hit $3 trillion by 2028.
Three Markets, Three Levels of Quality
The growth of the private credit and leveraged loan markets has been the catalyst for the increase in high yield credit quality, as weaker borrowers have turned to the other markets to obtain financing. The following patterns have emerged over the past 15+ years:
- Higher quality issuers favor high yield bonds
- Mid-quality borrowers gravitate towards leveraged loans
- The weakest borrowers rely on private credit
Of course, there is considerable overlap within each sector, so investors looking for BB exposure can easily find it in any of the three markets, just as aggressive investors looking for higher returns can find CCCs in all of the markets. But overall, the above patterns are well established at this point.
Higher Quality Borrowers Prefer High Yield
The increase in high yield credit quality is easiest to see when comparing the ratings breakdown of the current market versus 2009. Today, over half the market is made up of the highest quality high yield bonds (BB), and the lowest rating bucket has decreased to 11%, versus 23% in 2009.
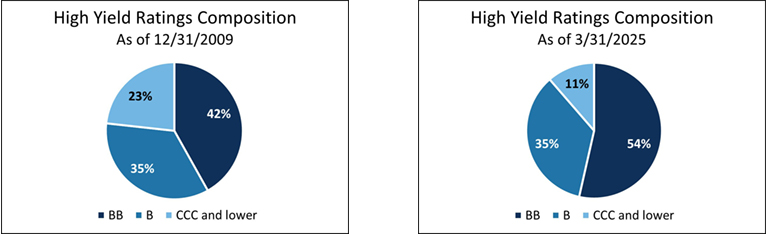
Source: ICE
The primary reason the high yield market has become the go-to destination for the highest quality sub-investment grade issuers is that it provides more favorable financing terms. High yield borrowers are required to disclose their financial statements and subject themselves to rigorous due diligence by investors, and in exchange for that transparency, they can generally issue debt with lower coupons than in either of the other two markets. There are other reasons a company might prefer the high yield market, such as existing investor relationships and/or familiarity with the issuance process, but pricing is certainly a key driver for higher quality borrowers.
Leveraged Loans Attract Mid-Quality Borrowers
Although leveraged loans have similar disclosure requirements to high yield bonds, the end investors in the two markets are quite different. Leveraged loans are generally purchased by structured finance managers who package them into Collateralized Loan Obligations (CLOs), which means they are much less sensitive than high yield investors to pricing, covenants, and underlying credit quality.
As the pie chart below shows, debt rated B makes up nearly two thirds of the leveraged loan market (as measured by the Bloomberg Leveraged Loan Index). This makes sense, as most CLOs are prohibited from including more than a modest percentage of CCC loans, so the rating target for the majority of issuers is B, as they remain eligible for securitization.
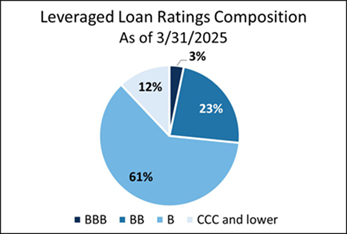
Source: Bloomberg U.S. Leveraged Loan Index
Private Credit Draws the Lowest Quality
The private market is opaque by design, so it is difficult to measure its credit quality precisely. But a 2024 study by the Board of Governors of the Federal Reserve summarized the market this way: “Given the low collateralizable assets and high leverage, it is likely that a significant share of borrowers would not be able to obtain adequate financing in the absence of private credit.”
It is not a coincidence that lower-quality borrowers are drawn to private credit. Even some companies that could access the public markets prefer it, as they are only required to share their financials with their individual lender, and they generally are not required to obtain an agency rating. These two important advantages allow them to avoid the stigma of an unfavorable rating and the scrutiny that comes with broad financial statement disclosure. Additionally, since most private credit funds have long lock-up periods, the secondary market is highly illiquid, so issues are rarely marked to market.
The spectacular growth of private credit also implies that it is the primary option for lower-quality borrowers. As mentioned above, the lowest-rated segments of both the high yield and leveraged loan markets are small (12% each), and the CCC portion of the high yield market has been shrinking for over a decade. At the same time, the private market has grown to roughly $1.7 trillion outstanding, which strongly suggests that the lower-quality borrowers have migrated into that sector.
Of course, not all of the debt in the private credit sector is low quality. Stronger companies also issue private debt, but those issuers tend to pay more than they would in the high yield market.
Credit Spreads: Low→Medium→High
Comparing credit spreads across the three markets reinforces the risk rankings described above. Specifically, high yield spreads post-GFC have been consistently tighter than leveraged loan spreads, which in turn have been consistently tighter than private credit spreads. (Tighter spreads indicate less perceived risk, as investors require less compensation from borrowers that are less likely to default.) Additionally, high yield spreads have tightened since 2009, which reflects the exodus of lower-quality borrowers from the sector as well as the relatively recent normalization of Treasury rates over the past few years.
High Yield Spreads Are Tightest
As the chart below shows, high yield spreads have consistently been tighter than leveraged loan spreads since the GFC, which aligns with expectations given the high yield market’s improving credit quality.
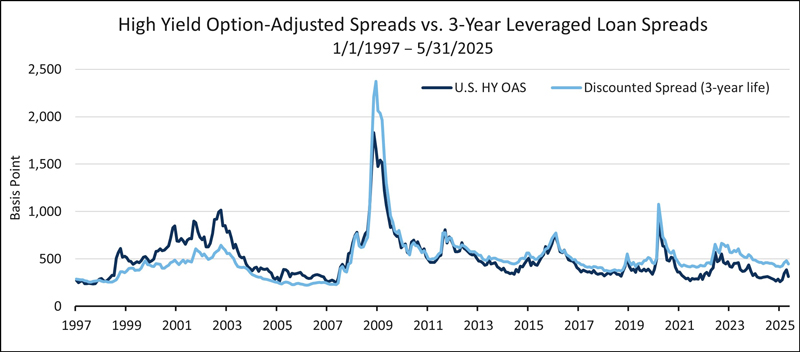
Source: Barclays High Yield Research
Additionally, the long-term trend for spreads in the high yield market supports the view that credit quality has improved post-GFC. Notice that spreads over the past few years are particularly tight by historical standards, which reflects the fact the high yield market is currently nearly 90% B and BB issuers. Importantly, yields have not fallen in line with spreads because underlying interest rates remain elevated.
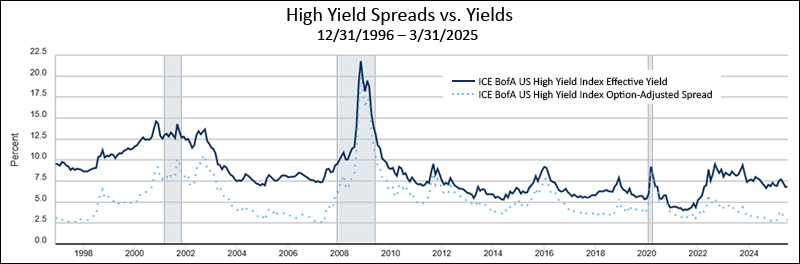
Source: ICE Data via FRED®. Shaded areas indicate U.S. recessions. Past performance does not guarantee future results.
It is also worth noting that heading into the GFC, even though nearly 60% of the market was rated below BB, high yield spreads were even lower than they are today, which means investors were not being paid for the risk they were taking. As the chart below shows, CCC spreads today are much wider than pre-GFC, while BB and B spreads are comparable. This is a sign of a healthy market.
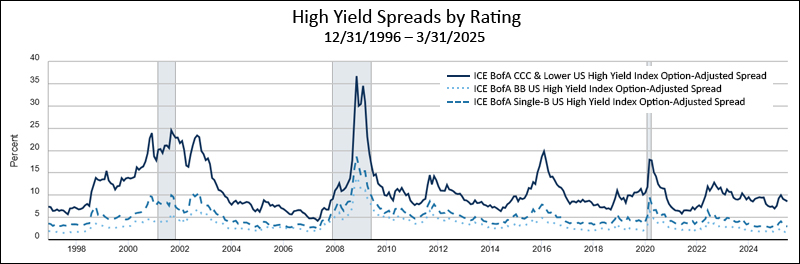
Source: ICE Data via FRED®. Shaded areas indicate U.S. recessions.
Loan Spreads Tighter Than Private Credit
As you can see from the chart below, leveraged loan spreads have been consistently tighter than private credit spreads going back to 2014 (the beginning of the Fed’s data set), which again tracks with our expectations. The combination of lower-quality borrowers and the lack of transparency in the private market drives up borrowing costs, which results in wider credit spreads than we observe in the leveraged loan and high yield markets.
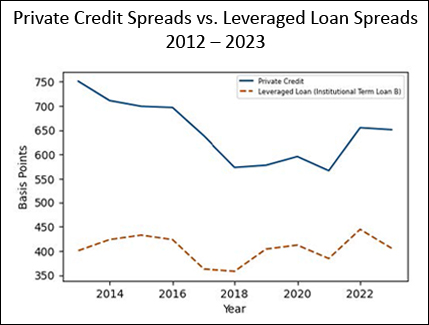
Source: Federal Reserve Board
Defaults Tell a Similar Story
Spreads and ratings are useful to help to measure credit risk, but ultimately fixed income investors care about defaults. In simplest terms, lenders want to receive all of their promised interest and principal payments. Looking at historical data, default rates have been lower in the high yield market than the leveraged loan market for the past few years, while the default data for private credit appears to be understated.
High Yield Default Rates Lower Than Loan Default Rates
High yield and leveraged loan default rates do not have a particularly stable relationship historically, but as you can see from the chart below, since the pandemic, high yield defaults have been far lower than loan defaults.
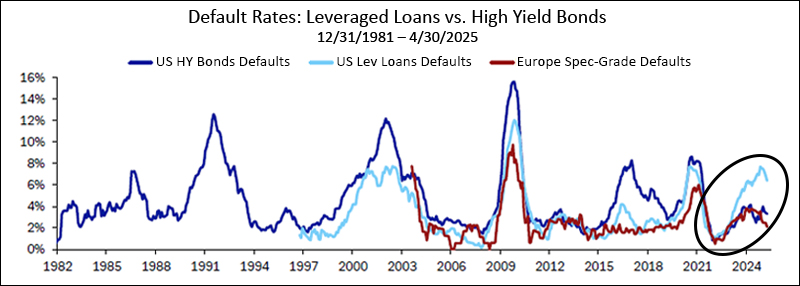
Source: Deutsche Bank, Moody's, S&P
Default Rates Likely Understated for Private Credit
Tracking defaults in the private market is more challenging. According to a 2024 study conducted by the Fed, default data coming from the private markets is likely understated:
Although private credit borrowers have lower credit quality on average than high-yield bond issuers, credit losses have been in line with other comparable credit markets to date. Private equity sponsors' equity interest in the companies, their active participation in the company operations and governance, and strong creditor control rights provided by covenant-heavy loan terms help private credit market borrowers to work out stress situations and avoid payment defaults or bankruptcies.
In other words, private borrowers avoid “default” by renegotiating with lenders, but in reality they are kicking the can down the road. This is particularly relevant for the private market, because, as the Fed also points out, “the private credit market, at its current scale, has not experienced a prolonged period of stress.” So, the companies that have restructured but not yet defaulted are likely more indebted now than they were before they renegotiated their terms, thereby increasing the probability of default in an economic downturn.
High Yield Returns Remain Attractive
Although the credit quality of the high yield market has improved since the GFC, it continues to deliver attractive returns. As expected, high yield bonds have substantially outperformed investment grade bonds on a cumulative basis over the past 25+ years.
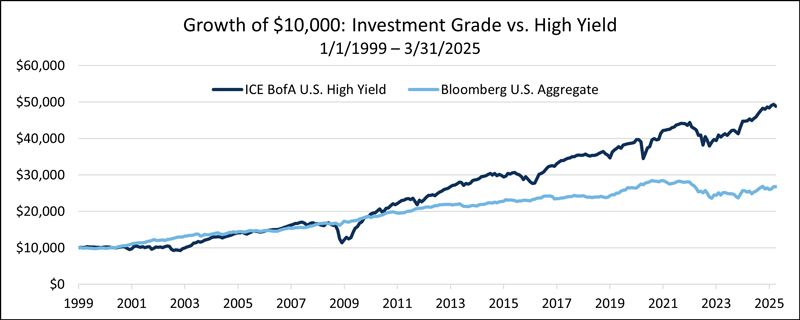
Source: Bloomberg, ICE, Osterweis. Past performance does not guarantee future results.
In addition, high yield outperformed private credit in 2024, which is a little unexpected given its lower risk profile. According to MSCI, U.S. private credit closed-end funds posted 7.6% internal rates of return in 2024, compared to 8.2% for public high yield bonds. Leveraged loans returned almost 9%.
Perhaps most surprisingly, there have been long stretches where the high yield market has outperformed equities. For the 20-year period starting in 1999, right before the dot com bubble burst, high yield bonds beat the S&P 500. Today’s AI-fueled rally somewhat resembles that period. While history does not repeat, it often rhymes, meaning that with equities near all-time highs, this may be an opportune time to reduce equity risk and shift to high yield. Of course, given the increase in credit quality, the absolute returns may be a little lower going forward, but they could still exceed equities if the recent bull run begins to peter out.
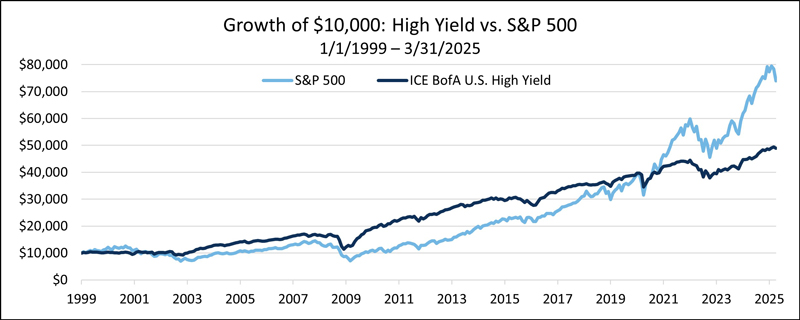
Source: S&P, ICE, Osterweis. Past performance does not guarantee future results.
In addition, as the rolling returns below demonstrate, high yield outperformed all asset classes for most of the first two decades of the 2000s. Looking at the five-year rolling returns, high yield was the top performer in six of the ten periods, with only investment grade corporates outperforming more than once. In the rolling ten-year periods, high yield outperformed five times, while the S&P 500 only did so three times.
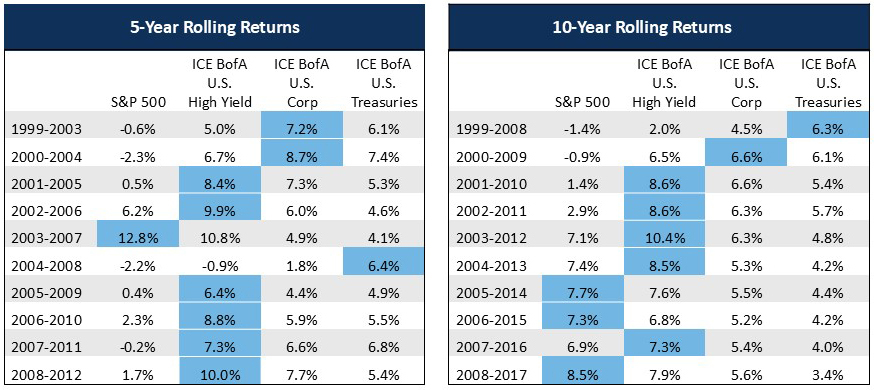
Source: RIMES. Past performance does not guarantee future results. The above returns are annualized.
Final Thoughts
The high yield market has undergone a significant transformation in the post-GFC era. In its early days, it was a clearinghouse for the lowest-rated publicly traded bonds, and it was well suited to aggressive investors willing to absorb some volatility in exchange for higher returns.
Today, many of the weaker borrowers that used to be a staple of high yield now seek financing in the private market, and to a lesser extent in the leveraged loan market. Since private debt has no secondary market, it is not marked to market daily, unlike high yield bonds. While this may help investors sleep at night, as their positions do not experience price volatility, it also masks the fact that their private credit exposure is likely the most risky part of their fixed income portfolio. And private credit is a relatively new asset class, which means it has yet to confront a protracted recession. Should one occur, all indications are that the market will experience substantial losses. In fact, given its generally lower credit quality and lack of transparency, we think investors would be wise to consider private credit as the new “junk” debt market.
Meanwhile, the high yield market is now hardly recognizable from its rough and tumble beginnings. Over half the market is rated BB, and another 35% is rated B. In other words, the credit quality has increased dramatically, while the transparency and liquidity remain near investment grade levels. In fact, we think it is time to christen the market with a new nickname: “investment grade-light.” Perhaps more importantly, we think it is time for investors to embrace it as part of their core fixed income allocation, particularly if they are working with skilled managers who can further mitigate risk through effective security selection.
References
Cai, Fang, and Sharjil Haque (2024). "Private Credit: Characteristics and Risks," FEDS Notes. Washington: Board of Governors of the Federal Reserve System, February 23, 2024, https://doi.org/10.17016/2380-7172.3462.
Degerli, Ahmet, and Phillip Monin (2024). "Private Credit Growth and Monetary Policy Transmission," FEDS Notes. Washington: Board of Governors of the Federal Reserve System, August 02, 2024, https://doi.org/10.17016/2380-7172.3565.
Ellias, Jared A. and Elisabeth De Fontenay, “The Credit Markets Go Dark,” The Yale Law Journal, Volume 134, Number 3, January 2025, https://www.yalelawjournal.org/article/the-credit-markets-go-dark.
Goel, Tirupam, “The Rise of Leveraged Loans: A Risky Resurgence,” BIS Quarterly Review, September 23, 2018, https://www.bis.org/publ/qtrpdf/r_qt1809u.htm.
Carl Kaufman
CIO – Strategic Income & Managing Director – Fixed Income
Craig Manchuck
Vice President & Portfolio Manager – Strategic Income
Bradley Kane
Vice President & Portfolio Manager – Strategic Income
John Sheehan, CFA
Vice President & Portfolio Manager – Strategic Income
Chris Shayne, CFA
Content Marketing Manager
Featuring


Carl Kaufman
CIO – Strategic Income & Managing Director – Fixed Income
Carl Kaufman has managed the Osterweis Strategic Income Fund since its inception and serves as the Managing Director of Fixed Income, as well as a Portfolio Manager for the Osterweis Growth & Income strategy. He is also a member of the firm’s Management Committee.
He joined Osterweis Capital Management in 2002, after nearly 24 years at Robertson Stephens and Merrill Lynch.
Carl graduated from Harvard University and attended New York University Graduate School of Business Administration.
Outside his professional endeavors, he enjoys playing classical piano and actively contributes to the community as a member of the Board of Trustees for the San Francisco Conservatory of Music, supporting the arts and enhancing the cultural fabric of the SF Bay Area. Additionally, he enjoys playing golf, an activity that continually challenges his patience and precision.


Craig Manchuck
Vice President & Portfolio Manager – Strategic Income
Craig Manchuck, a partner at Osterweis, is a Portfolio Manager for the strategic income strategy. In this role he enjoys investing clients’ assets in a common sense way that is designed to generate good risk-adjusted returns. Throughout his career, Craig has learned the importance of patience and that relationships with company management teams are invaluable.
Prior to joining Osterweis Capital Management in 2017, Craig was a Managing Director of Fixed Income Sales at Stifel Nicolaus, where he was responsible for sales and origination of high yield bonds, leveraged loans, and post reorg equities. Before Stifel, he held a similar role at Knight Capital. Before that, Craig was the Executive Director for Convertible Securities and then High Yield/Distressed Securities at UBS. He has previous experience in Convertible Securities Sales at Donaldson, Lufkin & Jenrette, SBC Warburg, and Merrill Lynch.
Craig graduated from Lehigh University with a B.S. in Finance and NYU Stern School of Business with an M.B.A. Outside of work, he enjoys golfing, wine, gardening, and spending time with family.


Bradley Kane
Vice President & Portfolio Manager – Strategic Income
Bradley (Brad) Kane is a Portfolio Manager for the strategic income strategy and a partner at the firm. In his role he leverages his extensive experience and deep understanding of the market to seek out opportunities to deliver clients attractive risk-adjusted returns.
Prior to joining Osterweis in 2013, Brad was a Portfolio Manager and Analyst at Newfleet Asset Management, where he managed both high yield and leveraged loan portfolios. Before that, he was a Vice President at GSC Partners, focusing on management of high yield and collateralized debt obligations. Earlier in his career, he managed high yield assets as a Vice President at Mitchell Hutchins Asset Management. In these positions he learned the importance of staying focused on one’s investing strategy and discovering new securities and investor types without succumbing to trends.
Brad graduated from Lehigh University with a B.S. in Business & Economics. Outside of his professional life, he enjoys playing golf and ice hockey, as well as indulging in his diverse taste in music, including a particular appreciation for heavy metal.


John Sheehan, CFA
Vice President & Portfolio Manager – Strategic Income
John Sheehan, a partner at Osterweis, is a Portfolio Manager for the strategic income strategy. In his role he appreciates the opportunity to contribute to clients feeling confident that their investments are positioned to meet their long-term goals. As a portfolio manager, he likes that the bond market is an ever-evolving game that blends art and science.
Prior to joining the Strategic Income team at the end of 2023, John was a portfolio manager for the total return strategy. Before that, he spent more than 20 years working at Citigroup, first as Managing Director responsible for Investment Grade Syndicate in New York City, where he advised issuers on accessing funding in the corporate bond market. Later at Citigroup, he was Managing Director in charge of West Coast Investment Grade Sales in San Francisco, where he covered several of the largest U.S. investment grade credit investors.
John graduated from Georgetown University with a B.A. in Economics. He holds the CFA designation and is a member of the CFA Society of San Francisco. Outside of work, John enjoys swimming and skiing with his family, as well as seeing live music.


Chris Shayne, CFA
Content Marketing Manager
Chris Shayne leads the firm’s investment content development efforts. He works closely with our portfolio management teams on a range of projects, including deep dives into sector dynamics and economic trends important to the firm’s strategies and positioning.
Prior to joining Osterweis in 2018, Chris was the Director of Content Marketing at Calypso Technology. He has spent his 25-year career at the intersection of finance, technology, and communications, including senior roles at Moody’s Analytics and BlackRock.
Chris graduated from the University of California, Berkeley with a B.A. in English Literature and San Francisco State University with an M.A. in English Literature. He holds the CFA designation and is a member of the CFA Society of San Francisco. Outside of work, Chris enjoys the outdoors, particularly surfing, hiking, and golfing, as well as spending time with his family and friends.
For more information about this strategy, please send us an email or call us at (800) 700-3316.
Mutual fund investing involves risk. Principal loss is possible. Past performance does not guarantee future results.
This commentary contains the current opinions of the authors as of the date above, which are subject to change at any time, are not guaranteed, and should not be considered investment advice. This commentary has been distributed for informational purposes only and is not a recommendation or offer of any particular security, strategy, or investment product. Information contained herein has been obtained from sources believed to be reliable but is not guaranteed.
The Osterweis Strategic Income Fund may invest in debt securities that are un-rated or rated below investment grade. Lower-rated securities may present an increased possibility of default, price volatility or illiquidity compared to higher-rated securities. The Fund may invest in foreign securities, which involve greater volatility and political, economic and currency risks and differences in accounting methods. Investments in debt securities typically decrease in value when interest rates rise. This risk is usually greater for longer-term debt securities. Small- and mid-capitalization companies tend to have limited liquidity and greater price volatility than large-capitalization companies. From time to time, the Fund may have concentrated positions in one or more sectors subjecting the Fund to sector emphasis risk.
The Osterweis Funds are available by prospectus only. The Funds’ investment objectives, risks, charges, and expenses must be considered carefully before investing. The summary and statutory prospectuses contain this and other important information about the Funds. You may obtain a summary or statutory prospectus by calling toll free at (866) 236-0050, or by visiting www.osterweis.com/statpro. Please read the prospectus carefully before investing to ensure the Fund is appropriate for your goals and risk tolerance.
Performance data quoted represent past performance; past performance does not guarantee future results. The investment return and principal value of an investment will fluctuate so that an investor’s shares, when redeemed, may be worth more or less than their original cost. Current performance of the Fund may be higher or lower than the performance quoted. Performance data current to the most recent month end may be obtained by calling shareholder services toll free at (866) 236-0050.
Where applicable, charts illustrating the performance of a hypothetical $10,000 investment assume the reinvestment of dividends and capital gains, but do not reflect the effect of any applicable sales charge or redemption fees. Such charts do not imply any future performance.
All charts and graphs displaying high yield spreads/yields that cite “ICE” as the source are using data from the ICE BofA U.S. High Yield Index.
Unless otherwise indicated, all charts and graphs displaying investment grade spreads/yields that cite “Bloomberg” as the source are using data from the Bloomberg U.S. Aggregate Bond Index.
All other data comes from the entity identified in the “source” caption beneath each chart or graph.
The Bloomberg U.S. Aggregate Bond Index (Agg) is widely regarded as the standard for measuring U.S. investment grade bond market performance. This index does not incur expenses and is not available for investment. The index includes reinvestment of dividends and/or interest income.
The Bloomberg U.S. Corporate Investment Grade Bond Index measures the investment grade, fixed-rate, taxable corporate bond market. It includes U.S. dollar-denominated securities publicly issued by U.S. and non-U.S. industrial, utility and financial issuers.
The Bloomberg U.S. Leveraged Loan Index measures the performance of the USD denominated, high-yield, floating-rate, institutional leveraged loan market.
Source for any Bloomberg index is Bloomberg Index Services Limited. BLOOMBERG® is a trademark and service mark of Bloomberg Finance L.P. and its affiliates (collectively “Bloomberg”). Bloomberg owns all proprietary rights in the Bloomberg Indices. Bloomberg does not approve or endorse this material, or guarantees the accuracy or completeness of any information herein, or makes any warranty, express or implied, as to the results to be obtained therefrom and, to the maximum extent allowed by law, neither shall have any liability or responsibility for injury or damages arising in connection therewith.
The ICE BofA U.S. High Yield Index tracks the performance of U.S. dollar denominated below-investment grade corporate debt publicly issued in the U.S. domestic market.
Effective 6/30/22, the ICE indices reflect transactions costs. Any ICE index data referenced herein is the property of ICE Data Indices, LLC, its affiliates (“ICE Data”) and/or its Third Party Suppliers and has been licensed for use by Osterweis Capital Management. ICE Data and its Third Party Suppliers accept no liability in connection with its use. See https://www.osterweis.com/glossary for a full copy of the Disclaimer.
These indices do not incur expenses (unless otherwise noted) and are not available for investment.
Investment grade/non-investment grade (high yield) categories and credit ratings breakdowns are based on ratings from agencies such as S&P, which is a private independent rating service that assigns grades to bonds to represent their credit quality. The issues are evaluated based on such factors as the bond issuer’s financial strength and its ability to pay a bond’s principal and interest in a timely fashion. S&P’s ratings are expressed as letters ranging from ‘AAA’, which is the highest grade, to ‘D’, which is the lowest grade. A rating of BBB- or higher is considered investment grade and a rating below BBB- is considered non-investment grade (high yield). Other credit ratings agencies include Moody’s and Fitch, each of whom may have different ratings systems and methodologies.
Spread is the difference in yield between a risk-free asset such as a Treasury bond and another security with the same maturity but of lesser quality.
Yield is the income return on an investment, such as the interest or dividends received from holding a particular security.
A basis point is a unit that is equal to 1/100th of 1%.
A leveraged buyout (LBO) is the acquisition of another company using a significant amount of borrowed money (bonds or loans) to meet the cost of acquisition. The assets of the company being acquired are often used as collateral for the loans, along with the assets of the acquiring company.
References to specific companies, market sectors, or investment themes herein do not constitute recommendations to buy or sell any particular securities.
There can be no assurance that any specific security, strategy, or product referenced directly or indirectly in this commentary will be profitable in the future or suitable for your financial circumstances. Due to various factors, including changes to market conditions and/or applicable laws, this content may no longer reflect our current advice or opinion. You should not assume any discussion or information contained herein serves as the receipt of, or as a substitute for, personalized investment advice from Osterweis Capital Management.
Osterweis Capital Management is the adviser to the Osterweis Funds, which are distributed by Quasar Distributors, LLC. [OCMI-764531-2025-07-03]
