Why Secular Growth Matters, and How We Find It
Why Secular Growth Matters Now
In 2021, secular growth stocks have been relative underperformers. Through May, the Russell 2000 Growth Index has returned 4.1% YTD, while the Russell 2000 Value index has returned 27.5% YTD. This is also reflected at the sector level of the complete Russell 2000 index, with growth areas such as Information Technology and Healthcare underperforming cyclical sectors such as Energy and Materials.
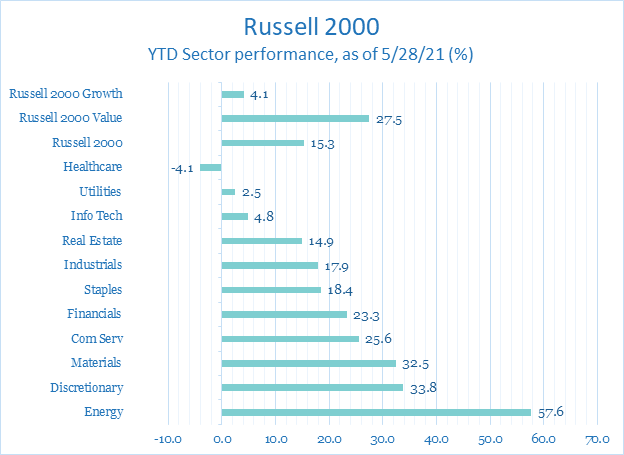
Source: Jefferies, Factset
The trend makes sense, as cyclical stocks are more sensitive to changes in GDP, and the economy has been expanding rapidly throughout the post-pandemic recovery. Not surprisingly, investors have been aggressively rotating into cyclicals during this period, as they were hit hard during the depths of Covid and were available at attractive valuations.
We feel this rotation has created an unusual buying opportunity for secular growth stocks, as they are generally 30% - 50% off their 52-week highs. When combined with their underlying growth rates, which have remained robust despite their tepid share performance, valuations look reasonable, especially on 5-year projected earnings.
Perhaps more importantly, we believe the present situation is an anomaly, and we expect growth stocks will reclaim their leadership position when the economy reaches its post-pandemic equilibrium. The current reopening process is (hopefully) a once-in-a-century event that has been driven by a powerful combination of pent-up demand and generous government stimulus. These tailwinds are both transitory, and when they abate, we are confident cyclicals will revert to more modest growth patterns.
How We Find Secular Growth: Exploiting Inefficiencies
Our investment philosophy is laser-focused on finding secular growth, as we believe this is the best way to generate long-term returns. Our objective is to build a concentrated portfolio of quality, small cap companies with superior revenue growth at attractive entry points. The challenge, of course, is identifying stocks that meet our criteria.
In our experience, there are four major categories of inefficiencies that create our investment opportunities: 1) growth rate, 2) growth durability, 3) valuation multiples, and 4) misclassification (i.e., growth companies masquerading as cyclicals).
When we add new positions to our portfolio, our view on at least one of these dimensions differs from the broader market, contributing to upside that is not widely identified.
Non-Linear Growth Rates Are Key
First and foremost, we seek to identify superior growth companies, both on an absolute and relative basis, that follow classic S-curves of adoption. Such S-curves are often underappreciated because they follow non-linear patterns of growth, and it can be very difficult for analysts to project exponential expansion due to the human tendency to think linearly.
We seek companies that are breaking out along such S-curves because growth can be both rapid and durable. For example, on his decision to start Amazon, Jeff Bezos said in a 2010 speech: “I came across the fact that Web usage was growing at 2,300 percent per year. I’d never seen or heard of anything that grew that fast, and the idea of building an online bookstore with millions of titles — was very exciting to me.”
It can be extremely rewarding when we discover companies that are finding strong product-market fit before the market recognizes the trend. For example, Five9 (FIVN) sells cloud-based contact center software that allows service reps to interact with customers through a variety of communications channels. Before Covid-19, the company was already growing market share as a disruptive, next gen vendor displacing legacy, on-premise systems in a $24 billion market that was only 10-15% penetrated by cloud software.
When we first purchased Five9 in 2019, the company was growing 28%. Since then, growth has accelerated to 45% in its most recent quarter, driven by an accelerating on-premise-to-cloud transition, as well as Five9’s expanding product portfolio, which includes artificial intelligence (AI) modules. Five9 is signing increasingly large deals, which haven’t even contributed to revenue yet. As an analyst from Morgan Stanley wrote, “to us this means that the accelerated moves to the cloud haven't even started yet, and FIVN is in the best position to capitalize on them as they do, with new large scale proof points."
Growth Has To Be Durable
Second, when analyzing secular growth companies, we think critically about the durability of growth and long-term earnings power. As Peter Thiel said, “80-85% of the value of these companies exists from cash flows...very, very far into the future…the question is whether a company is going to be around a decade from now is what actually dominates the value equation.” When assessing durability, we spend a great deal of time analyzing a company’s competitive advantage, and we utilize our proprietary anchor point framework to assess management’s ability to sustain growth and earnings over the long run.
Durability can be misjudged, which creates opportunities for us. For example, a recent study of cloud software IPOs by Bessemer1 found that growth rates have been more durable than expected post-IPO.
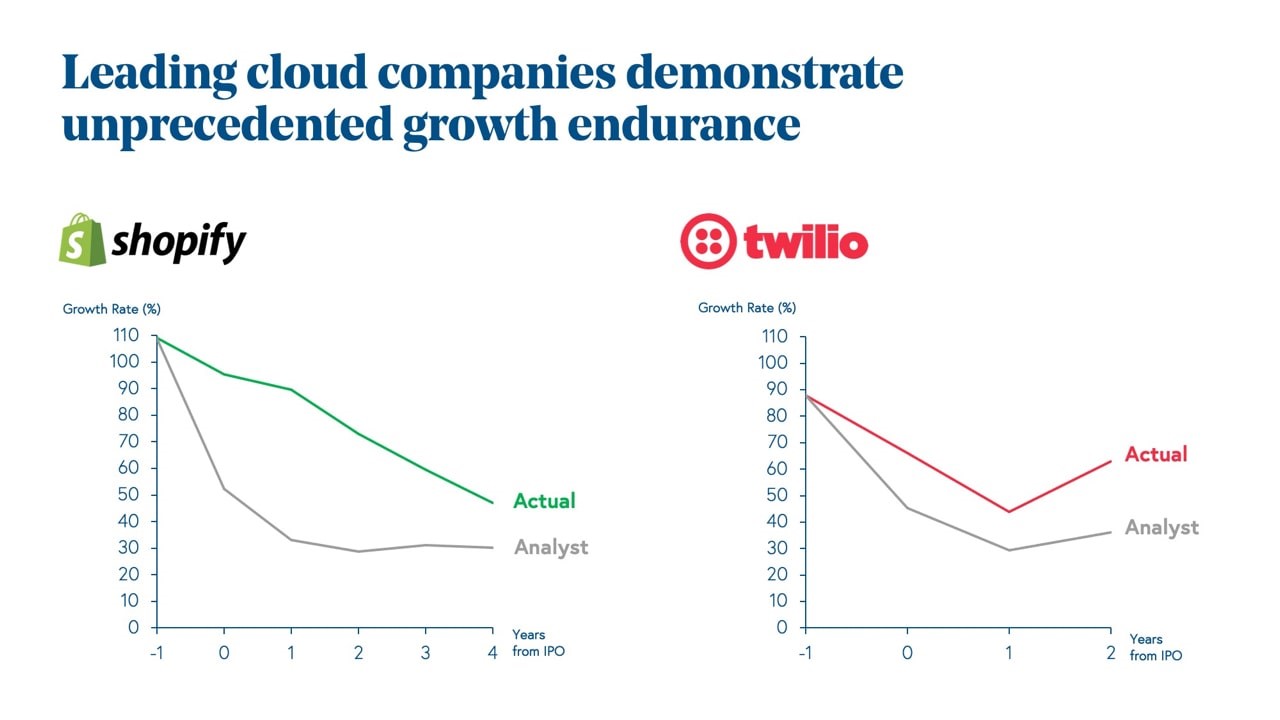
Source: Bessemer
As the above chart demonstrates, growth for both Shopify and Twilio has been much stronger and persisted longer than analysts expected.
Entry Points Make a (Big) Difference
Third, we seek attractive valuations by taking advantage of price dislocations due to 1) mystery (i.e., investors not yet appreciating a firm’s growth potential), 2) company mismanagement, and/or 3) general market corrections.
When successful, entry points for such investments can be quite cheap. This is because these stocks benefit both from the twin engines of sustained growth and multiple expansion over time. For example:
- In 2017, Etsy, an online marketplace for independent sellers, traded at 5x sales. Since then, its sales have grown from $441 million to a projected $2.2 billion in 2021, a 5-fold increase. In other words, in 2017, Etsy traded at just 1x projected 2021 sales!
- In 2019, Fiverr, an online marketplace for freelancers, traded at 3x sales. Since then, its sales have grown from $107 million to a projected $308 million in 2021, nearly a 3x increase. In other words, in 2019, Fiverr traded at ~1x projected 2021 sales!
To summarize, we strive to identify exceptional small cap growth companies that can grow both faster and longer than market expectations, and we look to buy when such companies are cheap and/or misunderstood.
Secular Growth Can Masquerade As Cyclical Growth
The last major type of inefficiency we try to exploit is the misclassification of companies that the market considers to be cyclical, whey they really possess secular growth characteristics.
For example, we believe the semiconductor/semiconductor capital equipment (semicap) industry is becoming more secular (vs. cyclical) for a few reasons. First, there are now multiple market drivers for semiconductor growth. From the 1990s through the early 2000s, the semiconductor industry was primarily driven by PC trends, and over the past decade, smartphones have become a major driver.
Today, we believe we are at a digital inflection point that will drive sustained growth across multiple areas, including data centers, the Internet of Things, 5G, and Artificial Intelligence. Second, the costs of manufacturing to drive Moore’s Law – doubling the number of transistors on a chip every year -- are significantly rising, requiring more engineering and processing, which benefits equipment companies. Third, countries are recognizing the critical importance of owning these crucial building blocks of the future and are increasing local investment. Along with other experts, we believe the semiconductor industry can double from $500 billion to $1 trillion in revenues by 2030.
A recent investment in this category is Onto Innovations, which sells critical semicap equipment necessary for manufacturers like Intel to accelerate development, increase yields, and reduce costs. Formed from the 2019 merger between Nanometrics and Rudolph, Onto is the fourth largest semicap equipment manufacturer in the U.S. and has an expanding product portfolio due to robust, complementary technology from the merger. The company currently generates strong growth and profits and expects to reach $1 billion in revenue over the medium term, which translates to >$5 in earnings power vs. the <$2 in earnings it earned in 2019. For the quality of business, it is also inexpensive, trading at ~20x 2022 price-to-earnings ratio.
Another example is Cerence, the dominant provider of conversational AI and voice technology used in cars and trucks, with >50% market penetration globally. A 2019 spin off from Nuance, Cerence is another example where the end market is cyclical (autos) but the majority of growth is secular, led by the increasing penetration of voice recognition/AI in passenger cars. Today, only around two-thirds of vehicles have this capability but over time that will go to 95%. At the same time, Cerence is adding new content/features that will double its revenues per car from $10 to $20. By 2030, Cerence could do $1.5 billion in sales and $10 in earnings, up from <$2 in earnings last year.
Why Secular Growth Matters In the Long Run
No matter the market environment, we find secular growth is overwhelmingly important to long-term value creation. In one 20-year study, the Boston Consulting Group (BCG) analyzed four drivers (revenue growth, margin, valuation multiple, and free cash flow) of S&P 500 returns over different time periods.
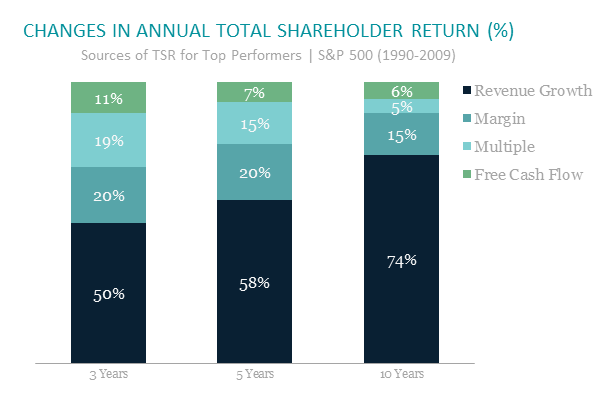
Source: Boston Consulting Group
Over one-year periods, no single factor contributed to more than 50% of performance, though the most significant factor was the valuation multiple. However, over 3, 5, and 10 years, revenue growth was the dominant driver of returns by far, contributing 50 to 74% of total shareholder return.
Final Thoughts
Regardless of the market environment, our philosophy has remained constant – we believe that secular growth is the key to generating long-term returns. We have established a rigorous, repeatable process for identifying high quality, attractively priced small cap growth stocks, and we find the current environment particularly favorable due to lower valuations and a growing number of innovative companies going public.
1 - “State of the Cloud 2021,” Bessemer Venture Partners, by Deeter, Robinson, D’Onofrio, Catlett, & Teng, 3/10/21. www.bvp.com
James Callinan, CFA
Co-CIO – Small Cap Growth & Portfolio Manager
Bryan Wong, CFA
Co-CIO – Small Cap Growth & Portfolio Manager
Featuring


James Callinan, CFA
Co-CIO – Small Cap Growth & Portfolio Manager
Jim Callinan, a partner at Osterweis, is a Portfolio Manager for the small cap growth strategy. Throughout his career he has focused on investing in companies that are early in their growth cycles. This experience has been the foundation of our high conviction, valuation-aware approach to investing in small cap growth companies.
Prior to Osterweis, Jim was the Co-Founder & Chief Investment Officer at RS Investments. He also founded the RS Growth Group LLC in 1996 and managed the RS Emerging Growth Fund from 1996 until 2010. In 1999 Jim was named Morningstar’s Domestic Stock Manager of the Year.*
Jim served as portfolio manager for the Putnam OTC Emerging Growth Fund from 1994 to 1996 and began his career at Putnam Investments as an equity research analyst in 1987. He joined Osterweis in 2016 and brought with him the Emerging Growth Partners, LP, a concentrated small cap growth strategy he founded at RS in 2006.
Jim graduated from Harvard College with a B.A. in Economics, New York University with an M.S. in Accounting, and Harvard Business School with an M.B.A. He holds the CFA designation and is a member of the Weatherbie Capital Advisory Board. Outside of work, Jim enjoys spending time with his family, travelling, and golfing.
*Morningstar Managers of the Year are determined by a combination of qualitative research by Morningstar’s manager research analysts; risk-adjusted medium- to long-term performance track records; and performance in the calendar year.


Bryan Wong, CFA
Co-CIO – Small Cap Growth & Portfolio Manager
Bryan Wong, a partner at Osterweis, is a Portfolio Manager for the small cap growth strategy. He is passionate about identifying overlooked opportunities with the potential to deliver strong, sustainable performance, helping clients achieve their long-term investment objectives. Bryan particularly enjoys investing in small companies, where the dynamic nature of the market provides fundamental investors the ability to gain a distinct edge through rigorous research and analysis.
Prior to joining Osterweis Capital Management in 2014, Bryan was a member of the investment team managing the endowment of the David and Lucile Packard Foundation. Before that, he was an Analyst at Wohl Capital Management, a long/short hedge fund.
Bryan graduated from Yale University with a B.A. in Political Science and International Studies with distinction and from the University of California Berkeley, Haas School of Business, with an M.B.A., where he was an Investment Management Fellow. He holds the CFA designation and is a member of the CFA Society of San Francisco. Bryan also serves on the investment committee of the Asian Pacific Fund. Outside of work, he enjoys spending time with family and swimming.
For more information about this strategy, please send us an email or call us at (800) 700-3316.
Related Insights
Opportunity Fund Quarter-End Performance (as of 6/30/26)
| Fund | 1 MO | QTD | YTD | 1 YR | 3 YR | 5 YR | 10 YR |
INCEP (10/1/2012) |
|---|---|---|---|---|---|---|---|---|
| OSTGX | 12.44% | 35.34% | 30.22% | 41.37% | 18.23% | 5.05% | 16.63% | 15.05% |
| Russell 2000 Growth Index | 3.55% | 25.71% | 22.18% | 38.74% | 18.44% | 5.57% | 11.97% | 11.67% |
Gross/Net expense ratio as of 3/31/26: 1.22% / 1.12%. The Adviser has contractually agreed to waive certain fees through June 30, 2027. The net expense ratio is applicable to investors.
Performance data quoted represent past performance; past performance does not guarantee future results. The investment return and principal value of an investment will fluctuate so that an investor’s shares, when redeemed, may be worth more or less than their original cost. Current performance of the Fund may be higher or lower than the performance quoted. Performance data current to the most recent month end may be obtained by calling shareholder services toll free at (866) 236-0050. Performance prior to December 1, 2016 is that of another investment vehicle (the “Predecessor Fund”) before the commencement of the Fund’s operations. The Predecessor Fund was converted into the Fund on November 30, 2016. The Predecessor Fund’s performance shown includes the deduction of the Predecessor Fund’s actual operating expenses. In addition, the Predecessor Fund’s performance shown has been recalculated using the management fee that applies to the Fund, which has the effect of reducing the Predecessor Fund’s performance. The Predecessor Fund was not a registered mutual fund and so was not subject to the same operating expenses or investment and tax restrictions as the Fund. If it had been, the Predecessor Fund’s performance may have been lower.
Rates of return for periods greater than one year are annualized.
Where applicable, charts illustrating the performance of a hypothetical $10,000 investment made at a Fund’s inception assume the reinvestment of dividends and capital gains, but do not reflect the effect of any applicable sales charge or redemption fees. Such charts do not imply any future performance.
The Russell 2000 Growth Index (Russell 2000G) is a market-capitalization-weighted index representing the small cap growth segment of U.S. equities. This index does not incur expenses and is not available for investment. This index includes reinvestment of dividends and/or interest.
References to specific companies, market sectors, or investment themes herein do not constitute recommendations to buy or sell any particular securities.
There can be no assurance that any specific security, strategy, or product referenced directly or indirectly in this commentary will be profitable in the future or suitable for your financial circumstances. Due to various factors, including changes to market conditions and/or applicable laws, this content may no longer reflect our current advice or opinion. You should not assume any discussion or information contained herein serves as the receipt of, or as a substitute for, personalized investment advice from Osterweis Capital Management.
Complete holdings of all Osterweis mutual funds (“Funds”) are generally available ten business days following quarter end. Holdings and sector allocations may change at any time due to ongoing portfolio management. Fund holdings as of the most recent quarter end are available here: Opportunity Fund
The outbreak of the COVID-19 pandemic and the resulting actions to control or slow the spread has had a significant detrimental effect on the global and domestic economies and financial markets. It is too early to determine the full impact this virus may have on certain industries and sectors. Should this emerging macro-economic risk continue for an extended period, there could be an adverse material financial impact to the Funds.
Opinions expressed are those of the author, are subject to change at any time, are not guaranteed and should not be considered investment advice.
The Osterweis Emerging Opportunity Fund’s top 10 holdings may be viewed by clicking here.
The S&P 500 Index is an unmanaged index that is widely regarded as the standard for measuring large-cap U.S. stock market performance.
The Russell 2000 Growth Index is a market capitalization weighted index representing those stocks within the approximately 2000 smallest companies in the universe of U.S. equities that exhibit growth characteristics.
The Russell 2000 Index is an index measuring the performance of the 2,000 smallest companies in the Russell 3000 Index.
The Russell 2000 Value Index measures the performance of Russell 2000 companies with lower price-to-book ratios and lower forecasted growth values.Holdings and allocations may change at any time due to ongoing portfolio management. References to specific investments should not be construed as a recommendation to buy or sell the securities. Current and future holdings are subject to risk.
Holdings and allocations may change at any time due to ongoing portfolio management. References to specific investments should not be construed as a recommendation to buy or sell the securities. Current and future holdings are subject to risk.
Cash flow measures the cash generating capability of a company by adding non-cash charges (e.g. depreciation) and interest expense to pretax income.
Price-to-Earnings (P/E) ratio is the ratio of the stock price to the trailing 12 months diluted EPS.
Mutual fund investing involves risk. Principal loss is possible. The Osterweis Opportunity Fund may invest in unseasoned companies, which involve additional risks such as abrupt or erratic price movements. The Fund may invest in small and mid-sized companies, which may involve greater volatility than large-sized companies. The Fund may invest in IPOs and unseasoned companies that are in the early stages of their development and may pose more risk compared to more established companies. Higher turnover rates may result in increased transaction costs, which could impact performance. From time to time, the Fund may have concentrated positions in one or more sectors subjecting the Fund to sector emphasis risk. The Fund may invest in foreign and emerging market securities, which involve greater volatility and political, economic and currency risks and differences in accounting methods. These risks may increase for emerging markets.
The Osterweis Funds are available by prospectus only. The Funds’ investment objectives, risks, charges, and expenses must be considered carefully before investing. The summary and statutory prospectuses contain this and other important information about the Funds. You may obtain a summary or statutory prospectus by calling toll free at (866) 236-0050, or by visiting www.osterweis.com/statpro. Please read the prospectus carefully before investing to ensure the Fund is appropriate for your goals and risk tolerance.
Osterweis Capital Management is the adviser to the Osterweis Funds, which are distributed by Quasar Distributors, LLC. [OSTE-20210616-0244]
