To Meet Your Investment Goals, Focus on Yields Rather Than Spreads
Yields vs. Spreads: Different Information for Different Investors
Yields and spreads are two common metrics used to evaluate fixed income securities, but they serve different purposes for different types of investors.
In our view, yields are far more relevant for absolute return investors. The yield on a bond is the return an investor can expect to receive at maturity, assuming the bond does not default. Thus, for traditional, long-only investors (i.e., those that do not use borrowed funds to purchase bonds), yields are what matter. Whether the investor is an endowment that needs to fund its operations or an individual trying to meet a savings goal (college tuition, home ownership, retirement, etc.), the best way to estimate future returns is to look at yields, not spreads.
In contrast, spread is the difference in yield between a fixed income asset and a reference rate (typically a U.S. Treasury bond of the same maturity). Investors demand excess compensation when investing in non-Treasury bonds to offset real and perceived risks, including liquidity, collateral, prepayment, default, and recovery (among others).
For fixed income investors that rely on leverage (i.e., buy bonds with borrowed money), such as hedge funds, spreads are essential. Their funding is always pegged to a reference rate, and their entire business depends on earning more than they are paying to borrow. Said differently, these investors are laser-focused on the difference between their cost of funds and their returns, which is most easily measured in spread. Similarly, Wall Street trading desks price the securities they hold relative to the risk-free rate, given that they also have funding costs, so the entire ecosystem of levered investors and market makers relies on spreads as a proxy for price.1
Yields Can Be Attractive Even If Spreads Are Tight
In theory, spreads are a great market signal, as they tend to widen when risk is elevated and tighten when times are good. But in practice, they can rise and fall for many other reasons, which limits their value as an information source. For example, spreads can move simply because the underlying reference rate changes, which has nothing to do with the credit quality of the issuer. As a result, yields can be attractive whether spreads are wide or tight, and vice-versa.
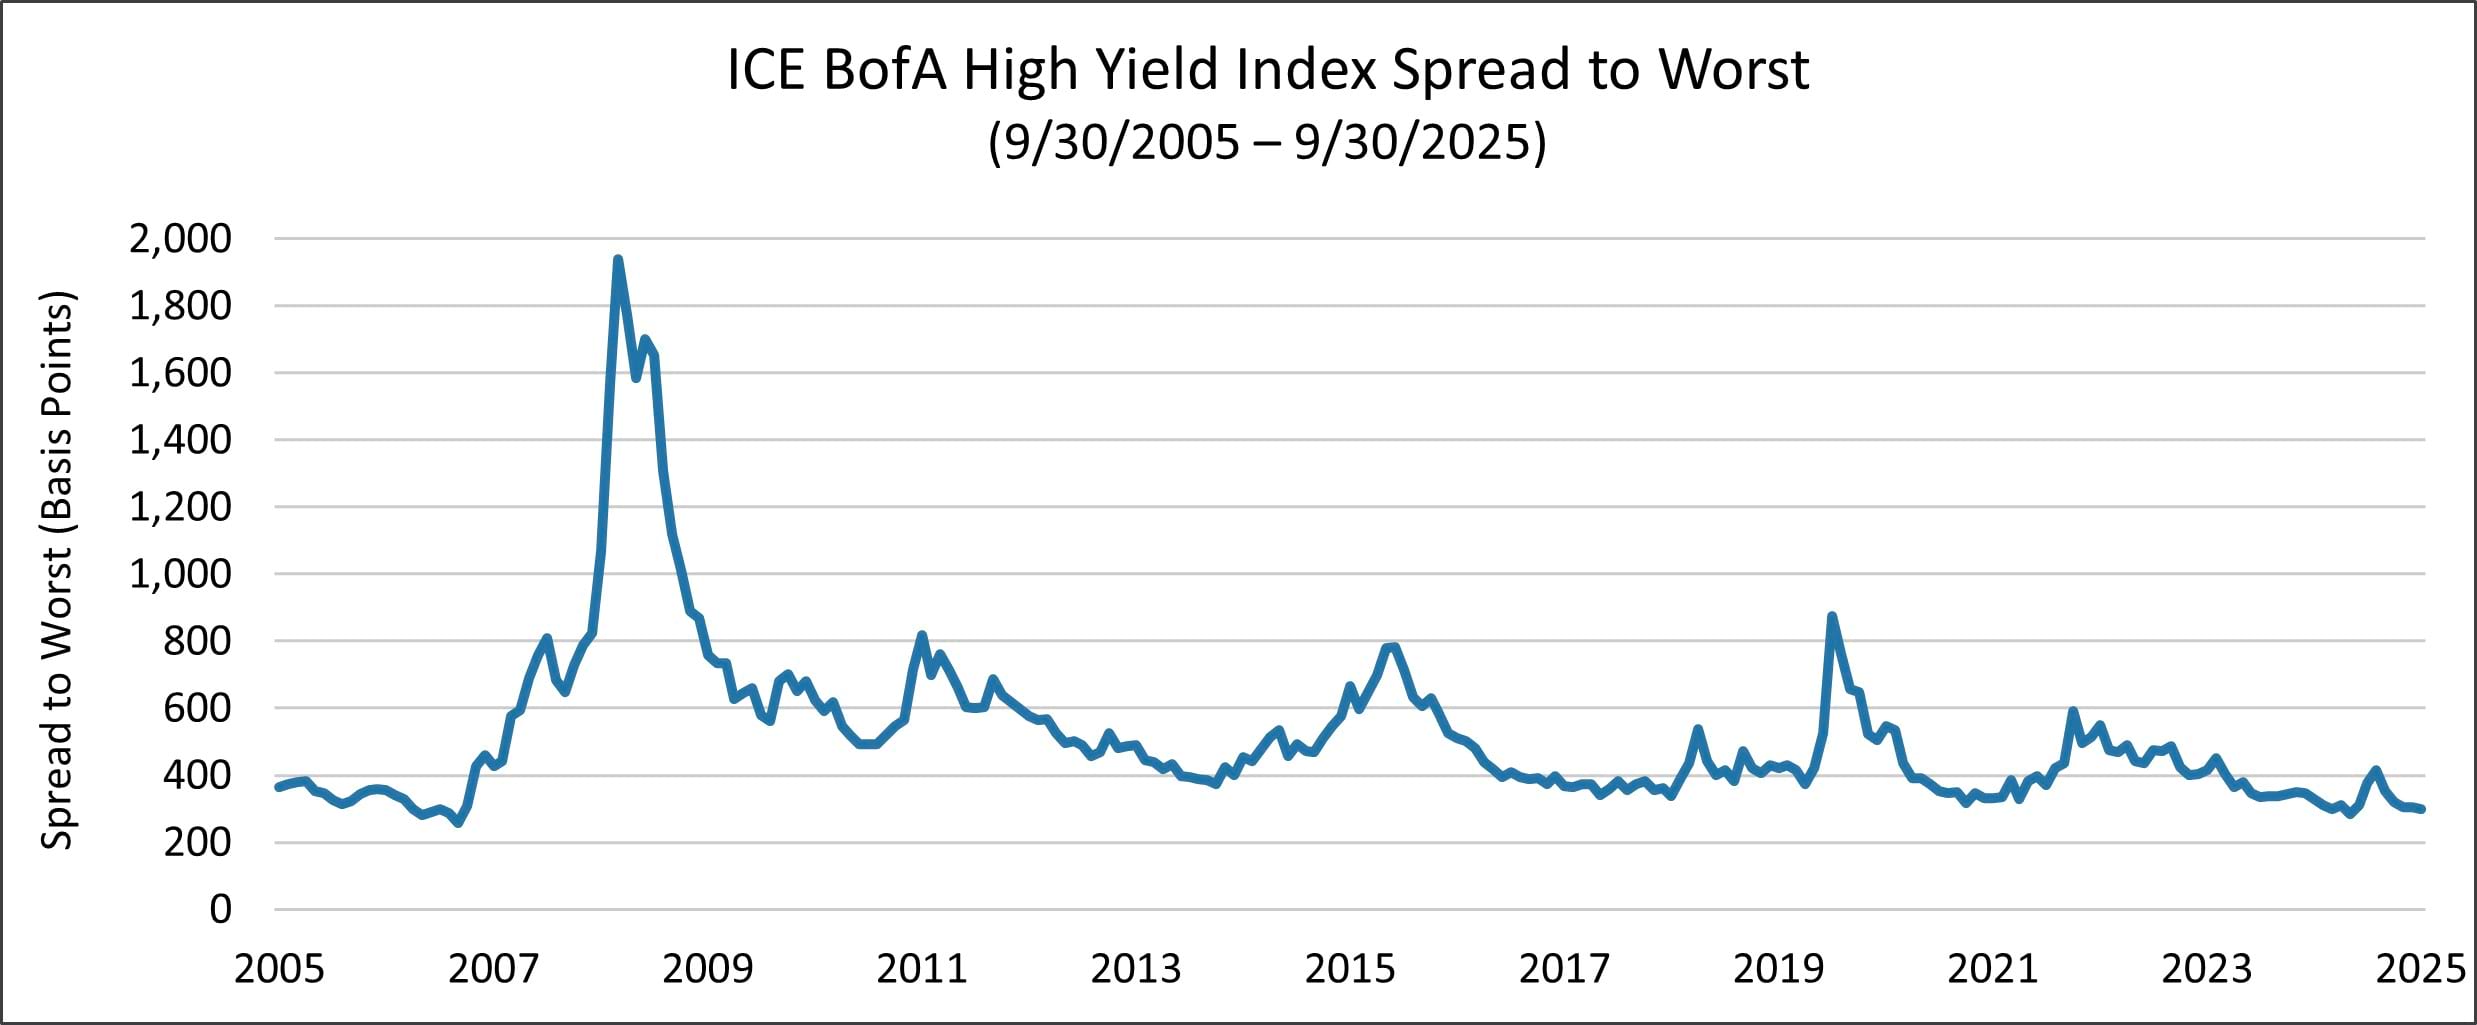
The current environment underscores this point. As we can see below, the spread of the ICE BofA High Yield Index is extremely tight right now – near the low point of the last 20 years.
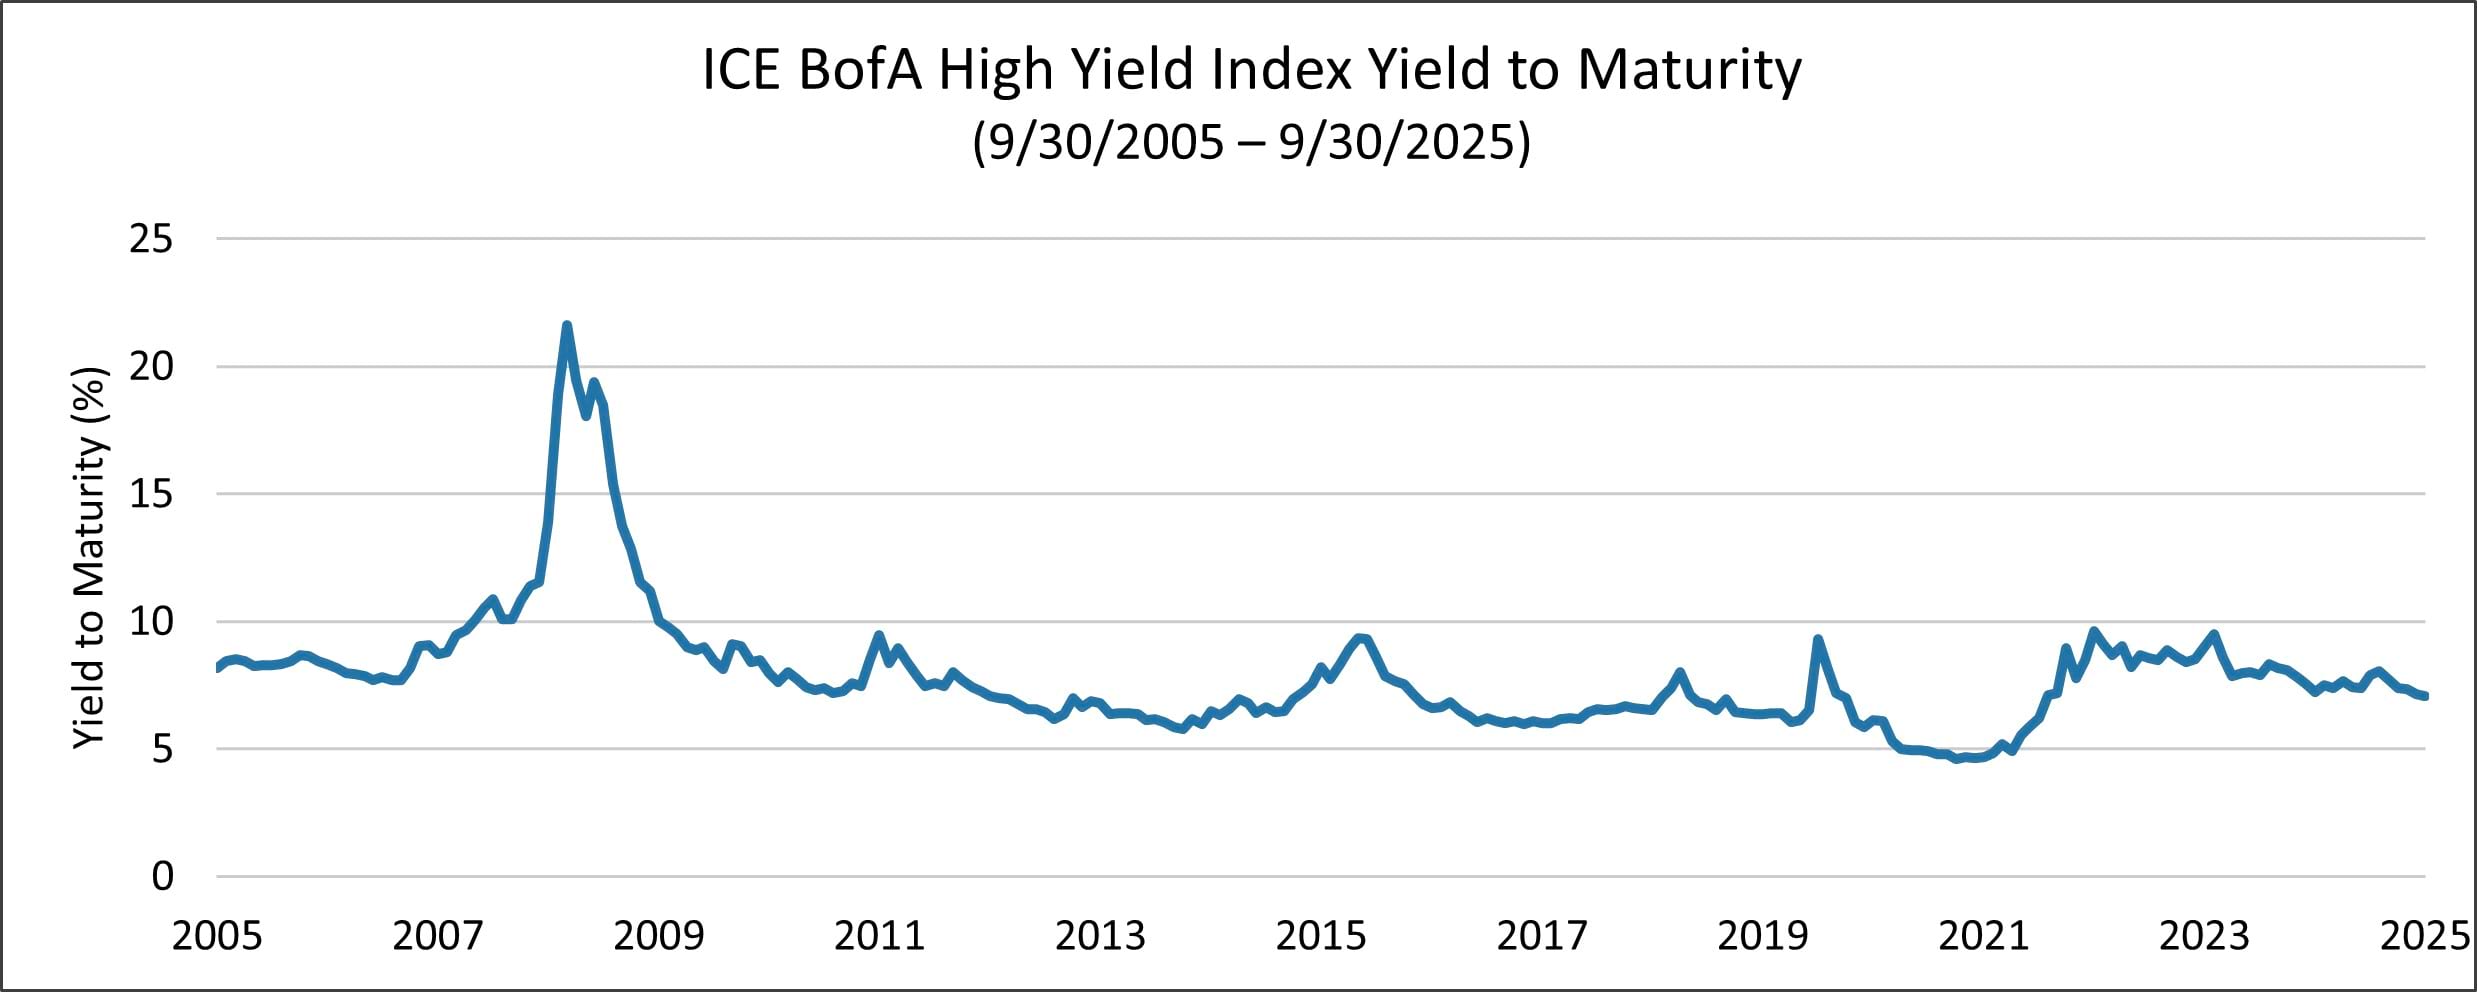
Yields, however, tell a different story. Despite historically tight spreads, they are fairly attractive right now, and they are about 250 basis points above the lows in 2021.
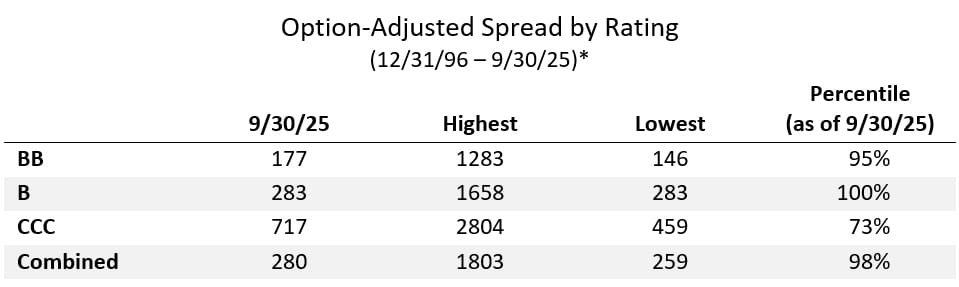
Similarly, index-level spreads can oversimplify what is happening in the market. For example, the current spread level of the ICE BofA High Yield Index is near its all-time low, suggesting that credit risk is also near a low point. But when we look at the index broken out by rating, we see a much different picture. Spreads are in fact quite tight for BBs and BBBs, the two highest rating categories, but for CCCs they are substantially wider, reflecting the drop-off in credit quality. As the table below shows, CCC spreads are in the 73rd percentile over the past 20 years, compared to the 95th and 100th for BBs and Bs, respectively.
Historical Spread Comparisons Are Challenging
Another limitation of index-level spreads is that they are difficult to compare across longer time horizons, as index compositions can change. For example, as we have discussed previously, the quality of the high yield bond market has improved substantially since the Great Financial Crisis, and the ICE BofA High Yield Index looks very different than it did in 2008. Today it is much more heavily weighted in the highest rating category (BB), while the lowest rating categories combined (CCC and below) have been nearly cut in half.
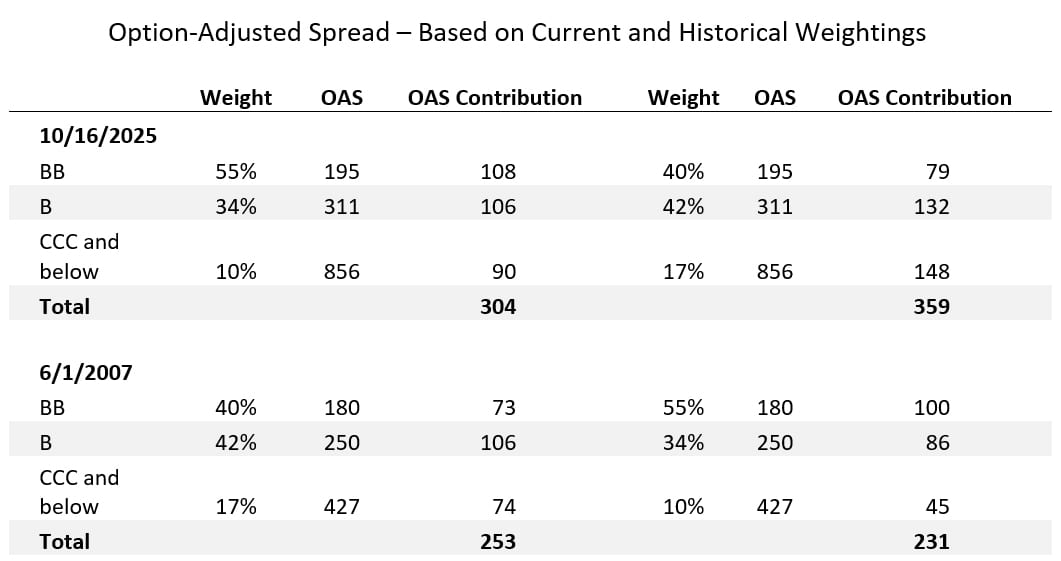
This re-weighting needs to be considered when comparing the spread of the index over time, as it is not an apples-to-apples comparison. As you can see in the table below, the high yield index spread is currently at 304 basis points, which makes it appear close to the 2007 level of 253 basis points.
However, if we were to take the weightings of the index from 2007 and apply 2025 spreads (by rating category), it would equate to an index spread of 359 basis points today. Conversely, if we were to apply today’s weightings to 2007, the spread would have been 231 basis points.
Final Thoughts
Where does this leave us? At the end of the third quarter, yields for the high yield index were 7.1%, which was the 40th percentile for the past 20 years. As value investors, we would always prefer to buy quality companies at higher yields, but from an absolute return perspective, these levels are still creating good opportunities for the portfolio and are not flashing signs of a bubble. In addition, between 1995 – 2025, the average 1-year forward return in periods that started with a 7% or higher yield is much better than the average for periods that started with a sub-7% yield.2
Still, we caution against making investment decisions based on a single factor. In our view, flexible, actively managed portfolios that consider the economic and market cycle work better than strategies with rigid, preset triggers.
1 Interestingly, spreads begin to lose their efficacy when a company is in distress. In these situations, the issuer’s bonds (and credit default swaps) move from trading on spread to trading on price. In other words, investors begin focusing on the borrower’s probability of default, and the underlying risk-free rate plays no role in determining the market price.
2 This statement is based on monthly data for the ICE BofA High Yield Index for the period 12/31/1994 through 10/31/2025. Past performance does not guarantee future results.
Featuring


John Sheehan, CFA
Vice President & Portfolio Manager – Strategic Income
John Sheehan, a partner at Osterweis, is a Portfolio Manager for the strategic income strategy. In his role he appreciates the opportunity to contribute to clients feeling confident that their investments are positioned to meet their long-term goals. As a portfolio manager, he likes that the bond market is an ever-evolving game that blends art and science.
Prior to joining the Strategic Income team at the end of 2023, John was a portfolio manager for the total return strategy. Before that, he spent more than 20 years working at Citigroup, first as Managing Director responsible for Investment Grade Syndicate in New York City, where he advised issuers on accessing funding in the corporate bond market. Later at Citigroup, he was Managing Director in charge of West Coast Investment Grade Sales in San Francisco, where he covered several of the largest U.S. investment grade credit investors.
John graduated from Georgetown University with a B.A. in Economics. He holds the CFA designation and is a member of the CFA Society of San Francisco. Outside of work, John enjoys swimming and skiing with his family, as well as seeing live music.


Carl Kaufman
CIO – Strategic Income & Managing Director – Fixed Income
Carl Kaufman has managed the Osterweis Strategic Income Fund since its inception and serves as the Managing Director of Fixed Income, as well as a Portfolio Manager for the Osterweis Growth & Income strategy. He is also a member of the firm’s Management Committee.
He joined Osterweis Capital Management in 2002, after nearly 24 years at Robertson Stephens and Merrill Lynch.
Carl graduated from Harvard University and attended New York University Graduate School of Business Administration.
Outside his professional endeavors, he enjoys playing classical piano and actively contributes to the community as a member of the Board of Trustees for the San Francisco Conservatory of Music, supporting the arts and enhancing the cultural fabric of the SF Bay Area. Additionally, he enjoys playing golf, an activity that continually challenges his patience and precision.


Craig Manchuck
Vice President & Portfolio Manager – Strategic Income
Craig Manchuck, a partner at Osterweis, is a Portfolio Manager for the strategic income strategy. In this role he enjoys investing clients’ assets in a common sense way that is designed to generate good risk-adjusted returns. Throughout his career, Craig has learned the importance of patience and that relationships with company management teams are invaluable.
Prior to joining Osterweis Capital Management in 2017, Craig was a Managing Director of Fixed Income Sales at Stifel Nicolaus, where he was responsible for sales and origination of high yield bonds, leveraged loans, and post reorg equities. Before Stifel, he held a similar role at Knight Capital. Before that, Craig was the Executive Director for Convertible Securities and then High Yield/Distressed Securities at UBS. He has previous experience in Convertible Securities Sales at Donaldson, Lufkin & Jenrette, SBC Warburg, and Merrill Lynch.
Craig graduated from Lehigh University with a B.S. in Finance and NYU Stern School of Business with an M.B.A. Outside of work, he enjoys golfing, wine, gardening, and spending time with family.


Bradley Kane
Vice President & Portfolio Manager – Strategic Income
Bradley (Brad) Kane is a Portfolio Manager for the strategic income strategy and a partner at the firm. In his role he leverages his extensive experience and deep understanding of the market to seek out opportunities to deliver clients attractive risk-adjusted returns.
Prior to joining Osterweis in 2013, Brad was a Portfolio Manager and Analyst at Newfleet Asset Management, where he managed both high yield and leveraged loan portfolios. Before that, he was a Vice President at GSC Partners, focusing on management of high yield and collateralized debt obligations. Earlier in his career, he managed high yield assets as a Vice President at Mitchell Hutchins Asset Management. In these positions he learned the importance of staying focused on one’s investing strategy and discovering new securities and investor types without succumbing to trends.
Brad graduated from Lehigh University with a B.S. in Business & Economics. Outside of his professional life, he enjoys playing golf and ice hockey, as well as indulging in his diverse taste in music, including a particular appreciation for heavy metal.
For more information about this strategy, please send us an email or call us at (800) 700-3316.
Mutual fund investing involves risk. Principal loss is possible. The Osterweis Strategic Income Fund may invest in debt securities that are un-rated or rated below investment grade. Lower-rated securities may present an increased possibility of default, price volatility or illiquidity compared to higher-rated securities. The Fund may invest in foreign securities, which involve greater volatility and political, economic and currency risks and differences in accounting methods. Investments in debt securities typically decrease in value when interest rates rise. This risk is usually greater for longer-term debt securities. Small- and mid-capitalization companies tend to have limited liquidity and greater price volatility than large-capitalization companies. From time to time, the Fund may have concentrated positions in one or more sectors subjecting the Fund to sector emphasis risk.
The Osterweis Funds are available by prospectus only. The Funds’ investment objectives, risks, charges, and expenses must be considered carefully before investing. The summary and statutory prospectuses contain this and other important information about the Funds. You may obtain a summary or statutory prospectus by calling toll free at (866) 236-0050, or by visiting www.osterweis.com/statpro. Please read the prospectus carefully before investing to ensure the Fund is appropriate for your goals and risk tolerance.
Performance data quoted represent past performance; past performance does not guarantee future results. The investment return and principal value of an investment will fluctuate so that an investor’s shares, when redeemed, may be worth more or less than their original cost. Current performance of the Fund may be higher or lower than the performance quoted. Performance data current to the most recent month end may be obtained by calling shareholder services toll free at (866) 236-0050.
Source for any Bloomberg index is Bloomberg Index Services Limited. BLOOMBERG® is a trademark and service mark of Bloomberg Finance L.P. and its affiliates (collectively “Bloomberg”). Bloomberg owns all proprietary rights in the Bloomberg Indices. Bloomberg does not approve or endorse this material, or guarantees the accuracy or completeness of any information herein, or makes any warranty, express or implied, as to the results to be obtained therefrom and, to the maximum extent allowed by law, neither shall have any liability or responsibility for injury or damages arising in connection therewith.
Spread is the difference in yield between a risk-free asset such as a Treasury bond and another security with the same maturity but of lesser quality. Option-Adjusted Spread is a spread calculation for securities with embedded options and takes into account that expected cash flows will fluctuate as interest rates change. Spread to Worst is based on yield to worst (the lowest potential yield that can be received on a bond, assuming there is no default).
Yield to maturity is the rate of return anticipated on a bond if it is held until the maturity date.
The ICE BofA U.S. High Yield Index tracks the performance of U.S. dollar denominated below-investment grade corporate debt publicly issued in the U.S. domestic market.
Effective 6/30/22, the ICE indices reflect transactions costs. Any ICE index data referenced herein is the property of ICE Data Indices, LLC, its affiliates (“ICE Data”) and/or its Third Party Suppliers and has been licensed for use by Osterweis Capital Management. ICE Data and its Third Party Suppliers accept no liability in connection with its use. See https://www.osterweis.com/glossary for a full copy of the Disclaimer.
Osterweis Capital Management is the adviser to the Osterweis Funds, which are distributed by Quasar Distributors, LLC. [OCMI-844530-2025-11-21]
