The Case for Health Care: A Double Dose of Cyclical and Secular Growth
Increased Utilization and Funding Accelerate Secular Growth
Health care is a textbook example of a secular growth industry — newer, more effective treatments regularly replace older, obsolete medications and devices. But health care can also be somewhat cyclical, with a variety of factors impacting its growth trajectory. We believe we are currently experiencing two cyclical trends that should materially accelerate the industry’s overall growth rate.
First, we appear to be in the early stages of a prolonged period of above-trend health care utilization, which should act as a strong tailwind. Lingering effects from the pandemic, combined with shifting demographics, have created a surge in demand that we expect to persist for several years. Second, the health care funding environment, particularly within the biotech industry, is experiencing an upward cycle, which not only helps the companies receiving the capital but also benefits their downstream suppliers. As small cap growth investors, we believe both trends will create attractive opportunities over the near-to-medium term.
Utilization on the Rise
Several major factors are contributing to increased utilization.
The Covid Effect
According to a research study conducted by the Harvard T.H. Chan School of Public Health, during the pandemic, roughly 20% of adults in the U.S. reported that their household members delayed receiving medical care, either because they did not want to or were unable to interact with the health care system.
This pent-up demand was exacerbated in the following years by a lack of labor availability, as roughly 100,000 nurses left the field post-Covid. The combination led to long wait times and backlogs. For example, the surgical equipment provider Stryker recently reported that patients are now required to wait six to seven months for orthopedic procedures, compared to three to four months before the pandemic.
Moreover, because so many patients delayed care during Covid, many existing health issues became more advanced. The Harvard study found that 57% of respondents experienced negative health consequences as a result. Not surprisingly, this has increased the urgency for patients to receive overdue care.
Shifting Demographics
Another important cyclical driver is the aging U.S. population. The average Baby Boomer is now around 70 years old, and a record 12,000 U.S. citizens are turning 65 each day (4.4 million a year), up from 10,000 just a few years ago. This is setting the stage for a protracted wave of health care utilization among a very large cohort of potential patients, which is a positive backdrop for medical device companies that benefit from higher procedure volumes.
Interestingly, many medical device companies are trading at low valuation levels not seen since 2015, leading to attractive opportunities even if the above assertion is wrong and utilization does not increase as expected. The market has taken notice, with two fairly large acquisitions to date. In early January, Axonics was acquired by Boston Scientific for $3.7 billion. More recently, Shockwave was acquired by Johnson & Johnson for a much more robust $13 billion. (Both of these were positions held in our portfolio at the time of the acquisitions, although we did not and do not hold the acquiring companies.)
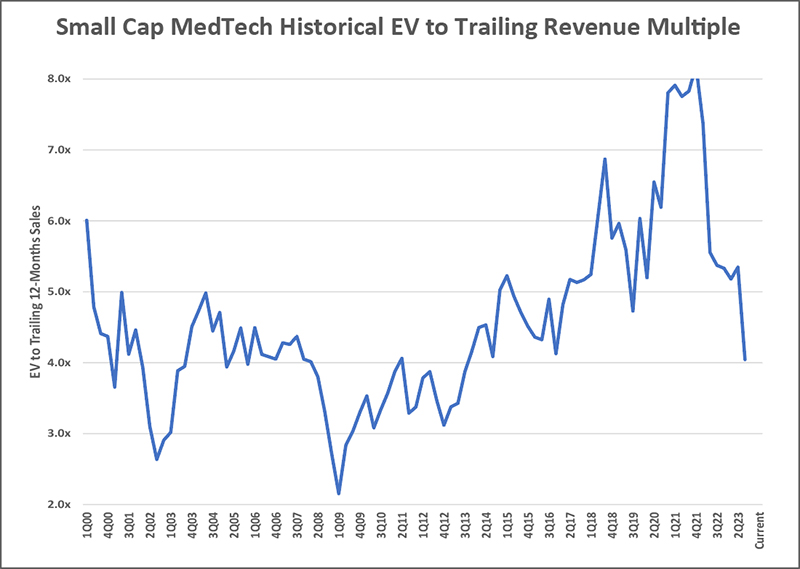
Source: J.P. Morgan, as of 12/30/23.
GLP-1s: A Manageable Concern
One potential offset to increased utilization is the emergence of GLP-1 medications, which reduce obesity and help patients develop healthier (less excessive) eating habits. This is a good outcome from a public health perspective, but over the long term we do not think it will materially decrease health care utilization. It may result in a decline in surgical weight loss procedures, such as bariatric surgery, but that is just a sliver of the total health care ecosystem.
We think statins offer a helpful analog to understand the longer-term impact of GLP-1s. Today, following steady adoption for the past two decades, around 80 million Americans are on statins, which help reduce cholesterol and other fats in the blood. Nonetheless, during this time, cardiovascular interventions/procedures have continued to grow annually, meaning statins have bent the curve but not caused it to go downward.
It is also worth noting that the highly touted SELECT trial run by Novo Nordisk to assess the impact of GLP-1s on cardiovascular events only showed an 8% improvement in the North American arm. This is further evidence that GLP-1s are not likely to significantly reduce the number of procedures over the long term.
Biotech Funding is Rebounding
The other cyclical tailwind that is currently benefitting the health care sector is an increase in biotech funding from investors, such as venture capital firms and public investment funds. Aggregate investment through the first quarter of 2024 is on pace to exceed $88 billion, which would be the highest level in the past ten years. This is obviously good for biotech firms, but just as importantly, it is positive for the businesses that supply the industry with products to conduct their research and run clinical trials. Life-science/tools companies should see accelerated growth during the second half of 2024 and above-trend growth for the next several years.
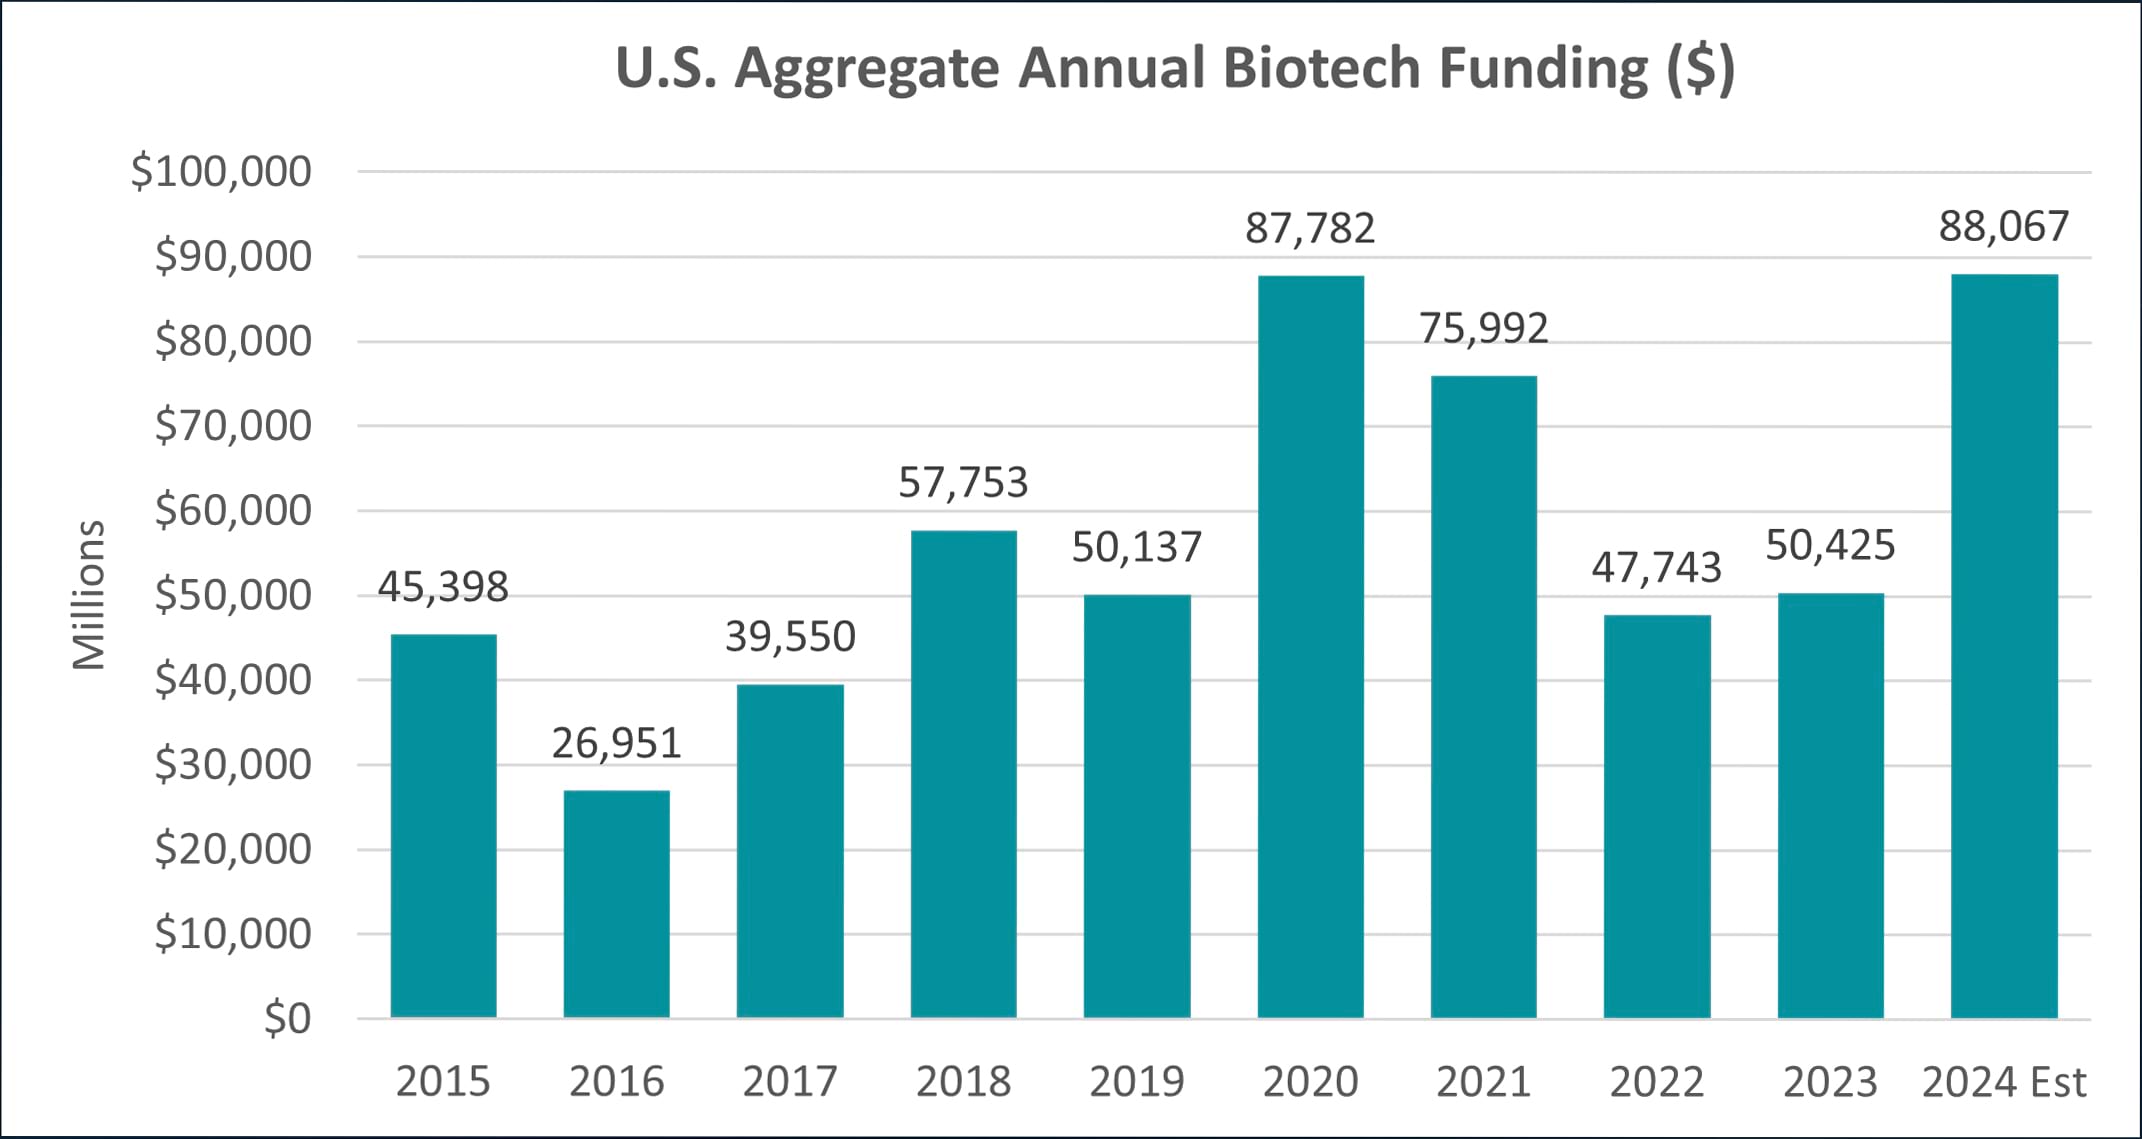
Source: Jefferies
The favorable funding environment is due to improved conditions in the biotech space. From the pandemic lows to the 2021 peak, the S&P Biotechnology Select Industry Index, which tracks small/mid cap biotech stocks, returned in excess of 165%. This, combined with record low interest rates, led to a bubble in valuations and a tremendous number of IPOs. Many of these companies were of low quality with limited or no clinical data. In the following years, these companies had disappointing data, and when combined with rising interest rates, investors ran for the hills. In early 2022, the index returned to pre-pandemic levels and biotech funding fell 37% year-over-year.
However, over time the cream has risen to the top, and recently we have seen better results and attractive valuations for clinically derisked data. Further validating that conditions have improved, acquisitions have also returned, with 11 deals over $1 billion since last November.
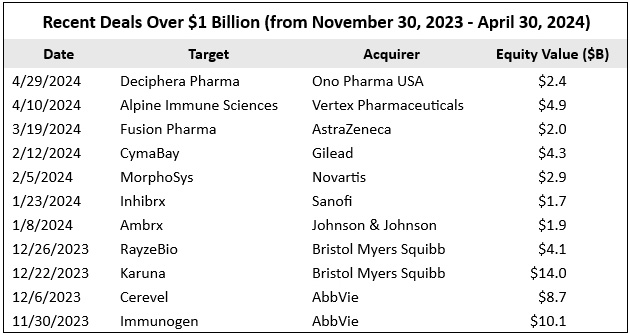
Source: Osterweis. Note: None of the referenced target or acquiring companies were held in the Emerging Opportunity Fund during the noted period.
Case Studies
Below are two health care stocks that we believe are well positioned to capitalize on the cyclical trends described above.
Bio-Techne (TECH)
Bio-Techne is a leading provider of antibodies, reagents, proteins, and immunoassays that are used by both biopharma and academic labs. Over the past decade, they have acquired a variety of smaller companies that have given them exposure to faster-growing areas such as proteomic analytical instruments, liquid biopsy, cell & gene therapy, and spatial biology. We believe this will lead to an impressive growth profile with industry-leading margins, particularly as the biotech space expands due to the current wave of funding.
UFP Technologies (UFPT)
We believe UFP Technologies will directly benefit from increased health care utilization. The company provides sub-assembly components to other medical device businesses like Stryker, Becton Dickinson, Intuitive Surgical, and many others. With procedure volumes expected to rise, UFP Technologies should see elevated sales, but they are also gaining a bigger share of wallet within these customers by moving up the value chain and becoming design partners on new products. This makes UFP’s relationships “stickier” in addition to improving margins. We particularly like the company’s exposure to the secular growth surrounding robotic surgery, as Intuitive Surgical is their largest customer.
Final Thoughts
As growth investors we are always looking for companies that are benefiting from structural economic changes. Health care has consistently been an excellent area to find those types of opportunities, as new treatments and technologies frequently render older options obsolete.
But the industry is also impacted by cyclical forces that can either slow down or accelerate its overall growth rate. We are currently in the midst of two different cyclical trends we believe will act as strong tailwinds, accelerating the secular growth that was already in place.
Matt Unger, CFA
Vice President & Portfolio Manager - Small Cap Growth
Opportunity Fund Quarter-End Performance (as of 12/31/25)
| Fund | 1 MO | QTD | YTD | 1 YR | 3 YR | 5 YR | 10 YR |
INCEP (10/1/2012) |
|---|---|---|---|---|---|---|---|---|
| OSTGX | -0.14% | 3.26% | 0.27% | 0.27% | 15.04% | 1.18% | 13.38% | 13.37% |
| Russell 2000 Growth Index | -1.28% | 1.22% | 13.01% | 13.01% | 15.59% | 3.18% | 9.57% | 10.45% |
Gross/Net expense ratio as of 3/31/25: 1.19% / 1.12%. The Adviser has contractually agreed to waive certain fees through June 30, 2026. The net expense ratio is applicable to investors.
Performance data quoted represent past performance; past performance does not guarantee future results. The investment return and principal value of an investment will fluctuate so that an investor’s shares, when redeemed, may be worth more or less than their original cost. Current performance of the Fund may be higher or lower than the performance quoted. Performance data current to the most recent month end may be obtained by calling shareholder services toll free at (866) 236-0050. Performance prior to December 1, 2016 is that of another investment vehicle (the “Predecessor Fund”) before the commencement of the Fund’s operations. The Predecessor Fund was converted into the Fund on November 30, 2016. The Predecessor Fund’s performance shown includes the deduction of the Predecessor Fund’s actual operating expenses. In addition, the Predecessor Fund’s performance shown has been recalculated using the management fee that applies to the Fund, which has the effect of reducing the Predecessor Fund’s performance. The Predecessor Fund was not a registered mutual fund and so was not subject to the same operating expenses or investment and tax restrictions as the Fund. If it had been, the Predecessor Fund’s performance may have been lower.
Rates of return for periods greater than one year are annualized.
Where applicable, charts illustrating the performance of a hypothetical $10,000 investment made at a Fund’s inception assume the reinvestment of dividends and capital gains, but do not reflect the effect of any applicable sales charge or redemption fees. Such charts do not imply any future performance.
The Russell 2000 Growth Index (Russell 2000G) is a market-capitalization-weighted index representing the small cap growth segment of U.S. equities. This index does not incur expenses and is not available for investment. This index includes reinvestment of dividends and/or interest.
References to specific companies, market sectors, or investment themes herein do not constitute recommendations to buy or sell any particular securities.
There can be no assurance that any specific security, strategy, or product referenced directly or indirectly in this commentary will be profitable in the future or suitable for your financial circumstances. Due to various factors, including changes to market conditions and/or applicable laws, this content may no longer reflect our current advice or opinion. You should not assume any discussion or information contained herein serves as the receipt of, or as a substitute for, personalized investment advice from Osterweis Capital Management.
Complete holdings of all Osterweis mutual funds (“Funds”) are generally available ten business days following quarter end. Holdings and sector allocations may change at any time due to ongoing portfolio management. Fund holdings as of the most recent quarter end are available here: Opportunity Fund
As of 3/31/2024, the Osterweis Emerging Opportunity Fund did not own Stryker or Novo Nordisk.
This commentary contains the current opinions of the authors as of the date above, which are subject to change at any time, are not guaranteed, and should not be considered investment advice. This commentary has been distributed for informational purposes only and is not a recommendation or offer of any particular security, strategy, or investment product. Information contained herein has been obtained from sources believed to be reliable but is not guaranteed.
The EV/TTM revenue multiple measures the ratio of a company’s enterprise value (equity market cap + total debt) to its trailing twelve-month sales.
Mutual fund investing involves risk. Principal loss is possible. The Osterweis Opportunity Fund may invest in unseasoned companies, which involve additional risks such as abrupt or erratic price movements. The Fund may invest in small and mid-sized companies, which may involve greater volatility than large-sized companies. The Fund may invest in IPOs and unseasoned companies that are in the early stages of their development and may pose more risk compared to more established companies. The Fund may invest in ETFs, which involve risks that do not apply to conventional funds. Higher turnover rates may result in increased transaction costs, which could impact performance. From time to time, the Fund may have concentrated positions in one or more sectors subjecting the Fund to sector emphasis risk. The Fund may invest in foreign and emerging market securities, which involve greater volatility and political, economic and currency risks and differences in accounting methods. These risks may increase for emerging markets.
The Osterweis Funds are available by prospectus only. The Funds’ investment objectives, risks, charges, and expenses must be considered carefully before investing. The summary and statutory prospectuses contain this and other important information about the Funds. You may obtain a summary or statutory prospectus by calling toll free at (866) 236-0050, or by visiting www.osterweis.com/statpro. Please read the prospectus carefully before investing to ensure the Fund is appropriate for your goals and risk tolerance.
Osterweis Capital Management is the adviser to the Osterweis Funds, which are distributed by Quasar Distributors, LLC. [OCMI-559182-2024-06-12]
