Patience Pays: Leaning Into the Inverted Yield Curve
The actions of the Federal Reserve, combined with a resilient economy, have created an opportunity in fixed income that is ideal for our unconstrained mandate. We have always attempted to win not only on offense, through careful security selection, but also on defense, by tactically increasing cash when market conditions are unfavorable.
Thanks to the inverted yield curve, our defensive strategy has become part of our offensive playbook. Simply by taking what the market is giving at the short end of the curve, we are able to get paid above the risk-free rate while we wait for opportunities in higher-yielding, longer-maturity bonds. The pressure to stretch for yield — either by sacrificing quality or extending duration — is near an all-time low.
How Did We Get Here?
In the period since the Covid crisis, yield curves and interest rates have re-priced and materially changed the landscape for fixed income investors. At the start of the pandemic, the Federal Reserve aggressively cut interest rates to support the economy. Then, after keeping rates near zero for two years and engaging in quantitative easing, they were compelled to undertake a rapid hiking cycle to combat inflation pressures (which began with Covid-induced supply chain issues and were exacerbated by massive fiscal stimulus programs). Despite calls for/speculation around rate cuts for the past 15 months, the Fed has left its benchmark rate unchanged since June of 2023, which has led to the longest period of an inverted yield curve in over 30 years. The traditional assumption of the inverted yield curve preceding a recession has not yet come to fruition, and in fact, the curve may stay inverted for some time before that happens.
Despite the material tightening of monetary policy, risk assets have performed exceptionally well. As you can see from the charts below, the yield to worst of the ICE BofA U.S. High Yield Index has largely remained flat since the Fed began its rate hikes and has fallen about 185 basis points from its peak in September 2022. Likewise, the yield on investment grade Bloomberg U.S. Corporate Bond Index has remained low and has recently fallen 105 basis points from its peak in October 2023, after rising meaningfully at the beginning of 2022. In addition, the option adjusted spread (OAS) of the investment grade corporate index (not pictured), which measures the spread of each issue in the index versus a risk-free bond of comparable maturity, is currently near the 95th percentile of the last decade. Said another way, over the last ten years, investment grade corporate spreads have been wider than we are now almost 95% of the time. Specifically, during this period, spreads have been only 10 basis points tighter but as much as 280 basis points wider.
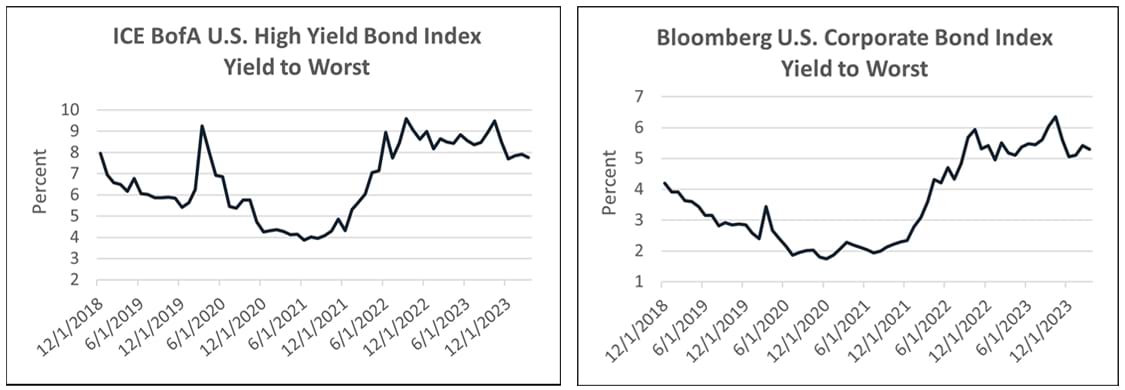
Yields have largely remained flat in both the high yield and investment grade indexes despite the Fed’s tightening program. Source: Bloomberg (as of 3/31/2024).
Cost of Staying Short Is Historically Low
The current environment presents us with two excellent options: 1) selectively investing in longer bonds of good companies with strong yields, or 2) acquiring short-dated instruments that are paying the most attractive levels in over a decade while we wait for even better opportunities. The yield to worst of the high yield index is now 7.75%, which is still attractive relative to the average yield of the past ten years of 6.54%. However, our alternative of investing in high quality short maturity paper has become more attractive by a greater margin. The difference in yield between the ICE BofA U.S. High Yield Index and 3-month T-Bills now sits at 264 basis points, well below the 10-year average of 514 basis points.
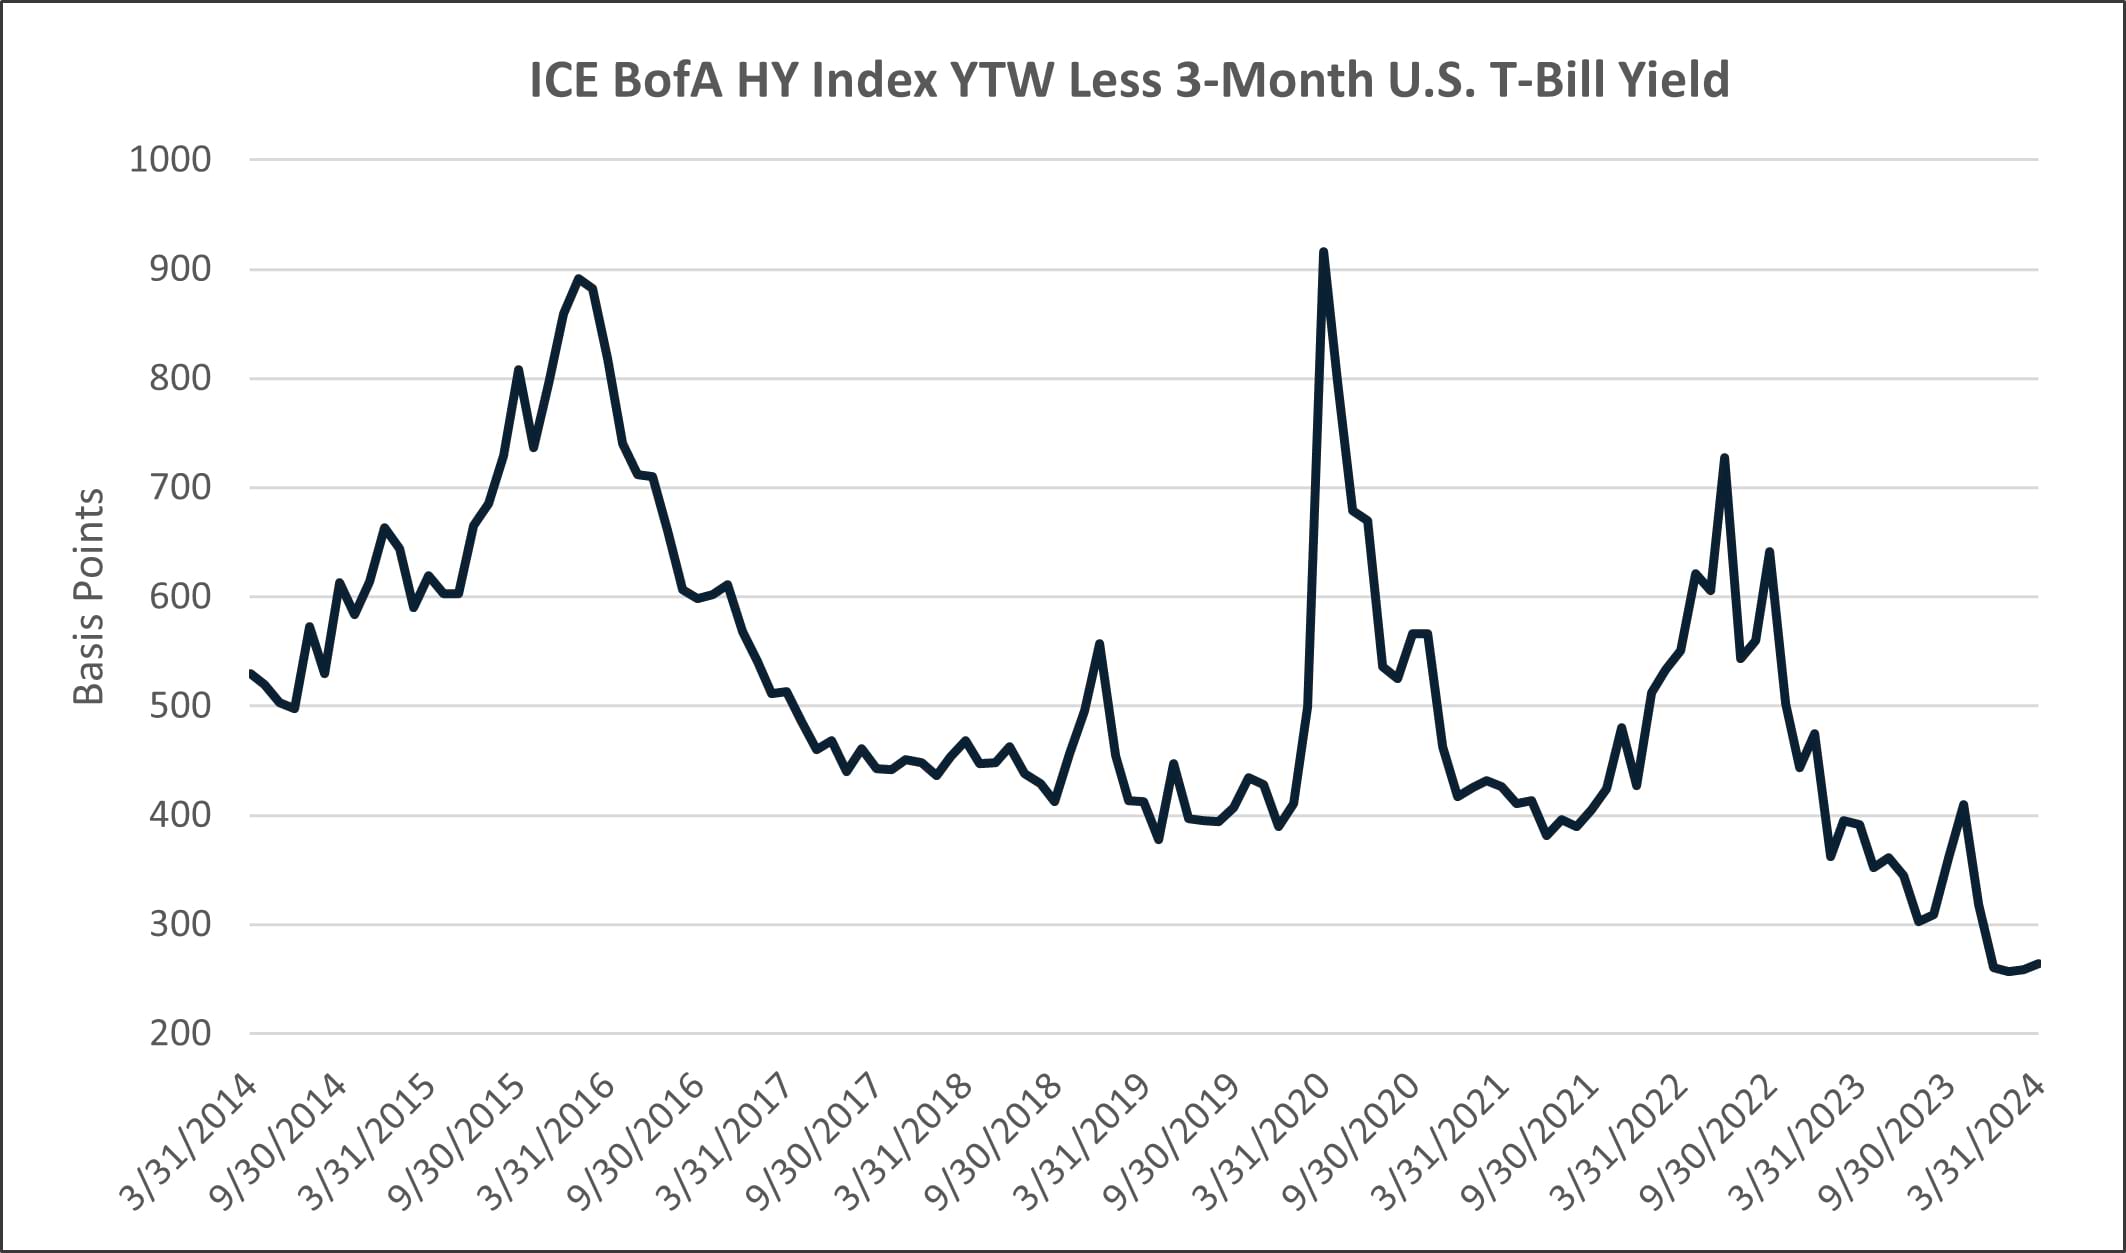
Bond spreads in the ICE BofA U.S. High Yield Index have continued to tighten, but they still pay over 260 basis points more than the 3-month U.S. T-Bill. Source: Bloomberg (as of 3/31/2024).
In summary, the cost of choosing high quality short duration bonds relative to bonds with more duration and/or credit risk is as low as we have ever seen it. The additional benefit of this dynamic is that it allows us to be even more selective in our risk taking. By not chasing riskier bonds or following the herd (into index issues or private equity sponsored deals, for example), we can lay the groundwork for lower volatility in the future. And of course, despite our elevated cash position, the fund’s returns have substantially outpaced T-Bills as the bulk of our portfolio remains in bonds maturing in two to five years, which has been the key to our strategy’s long-term success.
Final Thoughts
The Osterweis Strategic Income Fund has long used cash (and short-term securities) as a tactical asset. The primary use has been to seek safety when markets have experienced rallies and are priced near perfection. It helps us avoid the temptation of stretching for yield in riskier credits and/or into bonds that provide insufficient risk/reward profiles.
For most of the 15 years following 2008, the return on our cash has been near zero, so it was purely a defensive position intended to help the Strategic Income Fund avoid large losses. Said another way, we were winning by not losing. In this new interest rate regime, cash still helps us play defense, but it is also materially additive to our returns.
Thanks to the inverted curve, we are now sitting in the catbird’s seat — we can be as patient as we like while we wait for fat pitches.
John Sheehan, CFA
Vice President & Portfolio Manager – Strategic Income
Featuring


John Sheehan, CFA
Vice President & Portfolio Manager – Strategic Income
John Sheehan, a partner at Osterweis, is a Portfolio Manager for the strategic income strategy. In his role he appreciates the opportunity to contribute to clients feeling confident that their investments are positioned to meet their long-term goals. As a portfolio manager, he likes that the bond market is an ever-evolving game that blends art and science.
Prior to joining the Strategic Income team at the end of 2023, John was a portfolio manager for the total return strategy. Before that, he spent more than 20 years working at Citigroup, first as Managing Director responsible for Investment Grade Syndicate in New York City, where he advised issuers on accessing funding in the corporate bond market. Later at Citigroup, he was Managing Director in charge of West Coast Investment Grade Sales in San Francisco, where he covered several of the largest U.S. investment grade credit investors.
John graduated from Georgetown University with a B.A. in Economics. He holds the CFA designation and is a member of the CFA Society of San Francisco. Outside of work, John enjoys swimming and skiing with his family, as well as seeing live music.
For more information about this strategy, please send us an email or call us at (800) 700-3316.
Mutual fund investing involves risk. Principal loss is possible. Past performance does not guarantee future results.
This commentary contains the current opinions of the authors as of the date above, which are subject to change at any time, are not guaranteed, and should not be considered investment advice. This commentary has been distributed for informational purposes only and is not a recommendation or offer of any particular security, strategy, or investment product. Information contained herein has been obtained from sources believed to be reliable but is not guaranteed.
The Osterweis Strategic Income Fund may invest in debt securities that are un-rated or rated below investment grade. Lower-rated securities may present an increased possibility of default, price volatility or illiquidity compared to higher-rated securities. The Fund may invest in foreign securities, which involve greater volatility and political, economic and currency risks and differences in accounting methods. Investments in debt securities typically decrease in value when interest rates rise. This risk is usually greater for longer-term debt securities. Small- and mid-capitalization companies tend to have limited liquidity and greater price volatility than large-capitalization companies. From time to time, the Fund may have concentrated positions in one or more sectors subjecting the Fund to sector emphasis risk.
The Osterweis Funds are available by prospectus only. The Funds’ investment objectives, risks, charges, and expenses must be considered carefully before investing. The summary and statutory prospectuses contain this and other important information about the Funds. You may obtain a summary or statutory prospectus by calling toll free at (866) 236-0050, or by visiting www.osterweis.com/statpro. Please read the prospectus carefully before investing to ensure the Fund is appropriate for your goals and risk tolerance.
The Bloomberg U.S. Aggregate Bond Index (Agg) is widely regarded as the standard for measuring U.S. investment grade bond market performance. This index does not incur expenses and is not available for investment. The index includes reinvestment of dividends and/or interest income.
The Bloomberg U.S. Corporate Investment Grade Bond Index measures the investment grade, fixed-rate, taxable corporate bond market. It includes U.S. dollar-denominated securities publicly issued by U.S. and non-U.S. industrial, utility and financial issuers.
The ICE BofA U.S. High Yield Index tracks the performance of U.S. dollar denominated below-investment grade corporate debt publicly issued in the U.S. domestic market.
{indices_expenses}
Effective 6/30/22, the ICE indices reflect transactions costs. Any ICE index data referenced herein is the property of ICE Data Indices, LLC, its affiliates (“ICE Data”) and/or its Third Party Suppliers and has been licensed for use by Osterweis Capital Management. ICE Data and its Third Party Suppliers accept no liability in connection with its use. See https://www.osterweis.com/glossary for a full copy of the Disclaimer.
A yield curve is a graph that plots bond yields vs. maturities, at a set point in time, assuming the bonds have equal credit quality. In the U.S., the yield curve generally refers to that of Treasuries.
The yield to worst (YTW) is the lowest potential yield that can be received on a bond, assuming there is no default.
Spread is the difference in yield between a risk-free asset such as a Treasury bond and another security with the same maturity but of lesser quality.
Osterweis Capital Management is the adviser to the Osterweis Funds, which are distributed by Quasar Distributors, LLC. [OCMI-524586-2024-04-09]
