A Single Source for Both Income and Capital Appreciation?
A Differentiated Solution to an Age-Old Problem
Perhaps the greatest challenge most investors face is how to generate stable, growing income while at the same time enabling their principal to grow over time. Too much emphasis on current income can limit the potential growth of principal. Too much emphasis on principal growth usually entails very low current income. Over nearly 40 years we have refined a flexible approach to this problem, allowing us to optimize the competing goals of income and growth.
Rather than defining our goal as how best to balance the trade-off between income and growth, we redefine the goal as how best to achieve long-term income growth. By steadily growing income, we expect to achieve both greater total income over time and material capital appreciation.
To do this, we employ a flexible approach that relies mostly on high quality equities with growing dividends, coupled with attractive fixed income positions, especially short duration high yield bonds.
The use of short duration high yield bonds for our fixed income allocation enables us to include some lower-yielding equities with significant growth potential, while still maintaining above-average overall portfolio income. We believe this approach enables us to create an optimal blend of current income, income growth, and principal growth, all while dampening volatility and managing tax liabilities.
Equities: Quality Growth
We focus not on companies with the highest dividend yields, but rather companies with the ability to consistently grow their dividends over time. In fact, our concentrated equity portfolio tends to sport a dividend yield comparable to that of the S&P 500, but with a higher growth rate.
Quality Growth Matters
Quality Growth companies enjoy stable to improving returns on capital and typically have stable or improving revenue growth and margins. We focus on a select few companies that do not rely on excessive financial leverage. Critically, they generate substantial free cash flow through an economic cycle.
Additionally, we emphasize Quality Growth companies that benefit from secular growth trends. As we have discussed in the past, companies that operate in structurally growing sectors of the economy should have an easier time growing, especially during soft economic periods. And if the companies are differentiated and have durable competitive advantages, these businesses can enjoy attractive margin and return profiles, enabling them to grow free cash flow over time.
Dividends Do Not Lie
Extensive long-term studies by Ned Davis Research show that companies that pay growing dividends tend to deliver better returns than the broader market with less volatility. Such companies typically have only modest payouts, enabling them to reinvest cash flow to achieve future growth that then supports bigger future dividends.
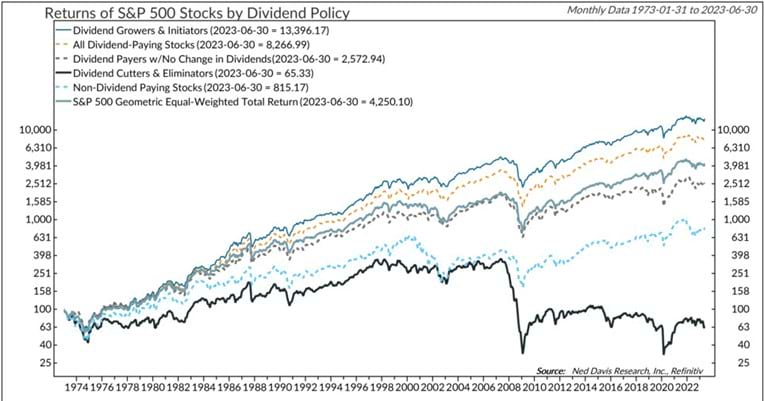
Source: © Copyright 2023 Ned Davis Research, Inc. Past performance does not guarantee future results. Indices are unmanaged and not available for direct investment. For illustrative purposes only.
The ability to pay a growing dividend for years, and even decades, often reflects business quality and durability. Companies that pay modest but consistent and growing dividends tend to focus on growth, maintain well-capitalized balance sheets, and avoid highly speculative areas of the economy. They also often operate in sectors with relatively stable demand, and they focus on the long-term.
Perhaps most importantly, dividends do not lie – companies that pay growing dividends almost by definition must generate significant and growing free cash flow, the bedrock of value creation for equities.
Portfolio Construction Should Further Mitigate Volatility
While historical evidence shows that dividend growth companies tend to deliver higher returns with less volatility, we believe that careful portfolio construction can further dampen volatility. We segment our equity portfolio across three categories: defensives, compounders, and offensives. By weighting compounders and defensives at 70-80% of the portfolio, we seek to further reduce volatility.
| Defensives (30-50%) | Companies that can generate profits in most any economic environment. |
| Compounders (30-40%) | Modestly cyclical companies that provide high-demand products & services. |
| Offensives (20-30%) | Cyclical businesses that are also experiencing secular growth. |
We define defensives as companies that can generate earnings and free cash flow growth in virtually any environment because they sell a product or service that is necessary every day, regardless of the economy. Think waste collection, consumer staples like toothpaste and mouthwash, or healthcare services.
We view compounders as businesses that might face some modest cyclicality but are equally necessary to businesses and consumers on a daily basis. These businesses may see a slowdown in growth during an economic soft patch, but they are much more resilient than the broader economy. Sectors like auto insurance, enterprise software, and medical devices all fit the framework of compounders.
Lastly, offensives are businesses that may operate in more cyclical industries but still enjoy secular growth. These companies can grow at very rapid rates during periods of economic expansion, but they can see profits temporarily contract during recessions. Offensive sectors include semiconductors, certain transportation sectors, and digital advertising.
Given our Quality Growth approach, we choose companies that are dominant in their industry or sector and enjoy significant competitive advantages that enable market share growth and pricing power. Therefore, even if a company faces periods of economic softness, it should fare better than the average business.
Fixed Income: Shorter-Term High Yield, with Flexibility
In our view, shorter-term high yield bonds pair particularly well with dividend growth stocks as part of an income-generating strategy, though we also believe it is important to stay flexible. Short-dated non-investment grade bonds are effective because they tend to generate higher income than dividend paying stocks, increasing the overall portfolio yield compared to an equity-only portfolio. Likewise, they normally pay higher coupons than their investment grade counterparts — even those with longer maturities — so they are a great fit for portfolios designed to generate income. In addition, as we discuss below, they dampen volatility (vs. equities) and reduce interest rate risk.
At the same time, we are always looking for the areas of the fixed income market that have the most attractive risk/reward characteristics, regardless of credit rating, sector, or maturity, so we will occasionally invest in Treasuries and/or investment grade bonds. We are careful not to stretch for yield, but we are opportunistic when good values present themselves.
Short-Duration High Yield: An Effective Approach to Managing Risk
Fixed income holdings reduce overall portfolio volatility. We utilize the same approach as our Strategic Income Fund (OSTIX), which is a flexible strategy that tends to focus on shorter-term high yield bonds. As you can see from the scatterplot below, this approach has been successful. The x-axis plots the downside capture ratio, which measures how an investment performs during falling markets. A lower number is better, as it indicates the portfolio is less correlated with changes in the market. The y-axis plots the upside capture ratio, which of course is the opposite, and a higher number is better.
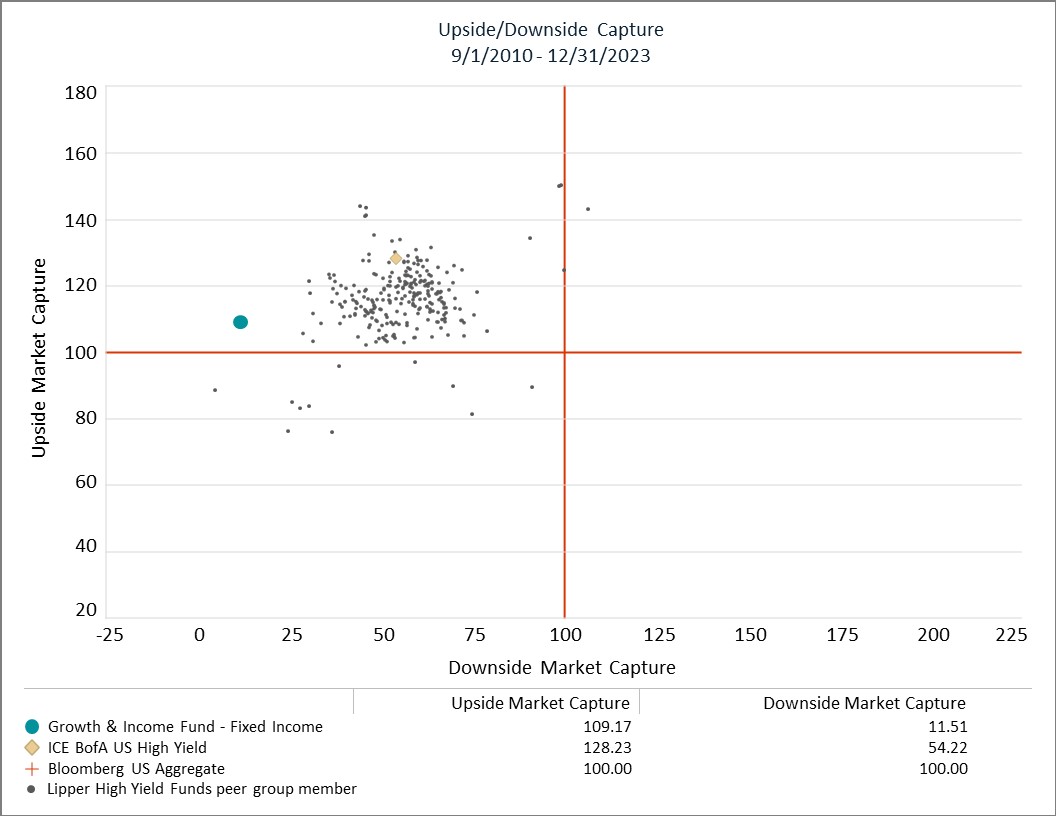
Upside/downside capture for the Fixed Income portion of the Growth & Income Fund is based on net returns calculated by applying 1/12 of the actual annualized expense ratio to each monthly gross return of the fixed income asset class. Please see the disclosures for standardized performance for the fund as of the most recent quarter end. Source: eVestment. Analysis period from 9/1/2010 - 12/31/2023. Lipper High Yield Funds peer group: 262 members. Please see the disclosures for additional information on upside and downside market capture.
Since inception, the downside capture of the fixed income portion of the Growth & Income Fund is decidedly lower than both the high yield index and nearly every high yield bond fund in the Lipper universe. At the same time, the upside capture is near the midpoint of the peer group and is approaching the high yield index.
In addition, shorter-term high yield bonds are exposed to less interest rate risk than investment grade bonds of comparable maturity. Interest rate risk, also known as duration, decreases as maturities fall and yields rise. They also carry less credit risk than similarly rated longer maturity issues, as the issuing company may already have cash on its balance sheet sufficient to pay off the shorter maturity bond, and there is less risk of something going wrong for the company than there is for longer maturity bonds.
Flexibility Provides Opportunity
We also make a point of staying flexible, so we are able to adjust our holdings should market conditions change. For example, when macro risks appear particularly elevated, we generally increase our allocation to short-duration Treasuries. Alternately, when it is apparent that the Federal Reserve plans to cut rates, we look to invest in longer-duration Treasuries to capture the impact of lower future rates.
Our demonstrated ability to be flexible within the fixed income portion of our portfolio further differentiates the strategy and enables us to not only strive to protect portfolios but also benefit from periods of economic stress.
Tax Efficiency Matters
Given our multi-decade history of managing client portfolios for high net worth families, tax considerations are often paramount.
We seek to own companies for the long term. This not only enables our quality businesses to grow and create value over time, but it helps with tax management as long-term capital gains tax take effect over ordinary income tax rates. Given that long-term capital gains tax rates can be much lower than ordinary income tax rates, a patient long-term approach can be much more tax efficient. Furthermore, we are highly conscious of using tax loss harvesting when appropriate.
The Desired Outcome: Consistent Growth and Income
We carefully construct our equity and fixed income portfolios with an eye towards generating equity-like returns over time, with both income generation and significant capital appreciation.
Our equity portfolio targets a minimum of 8-10% annual earnings and free cash flow growth, and we complement that with fixed income investments that enhance total portfolio income. This combination of yield and growth is designed to deliver attractive, consistent returns over the long term.
The following chart plots the cumulative growth of $100,000 from the fund’s inception in 2010 through December 31, 2023, using three different reinvestment scenarios. The bar graph that follows shows the annual income distribution investors would have received at the end of 2011 and how those distributions would have grown based on the same reinvestment scenarios. As you can see, regardless of the reinvestment strategy, the fund generated a healthy income stream while still appreciating meaningfully over time. (Note that the figures below do not reflect any impact of taxes. Please see disclosures for the Growth & Income Fund’s performance.)
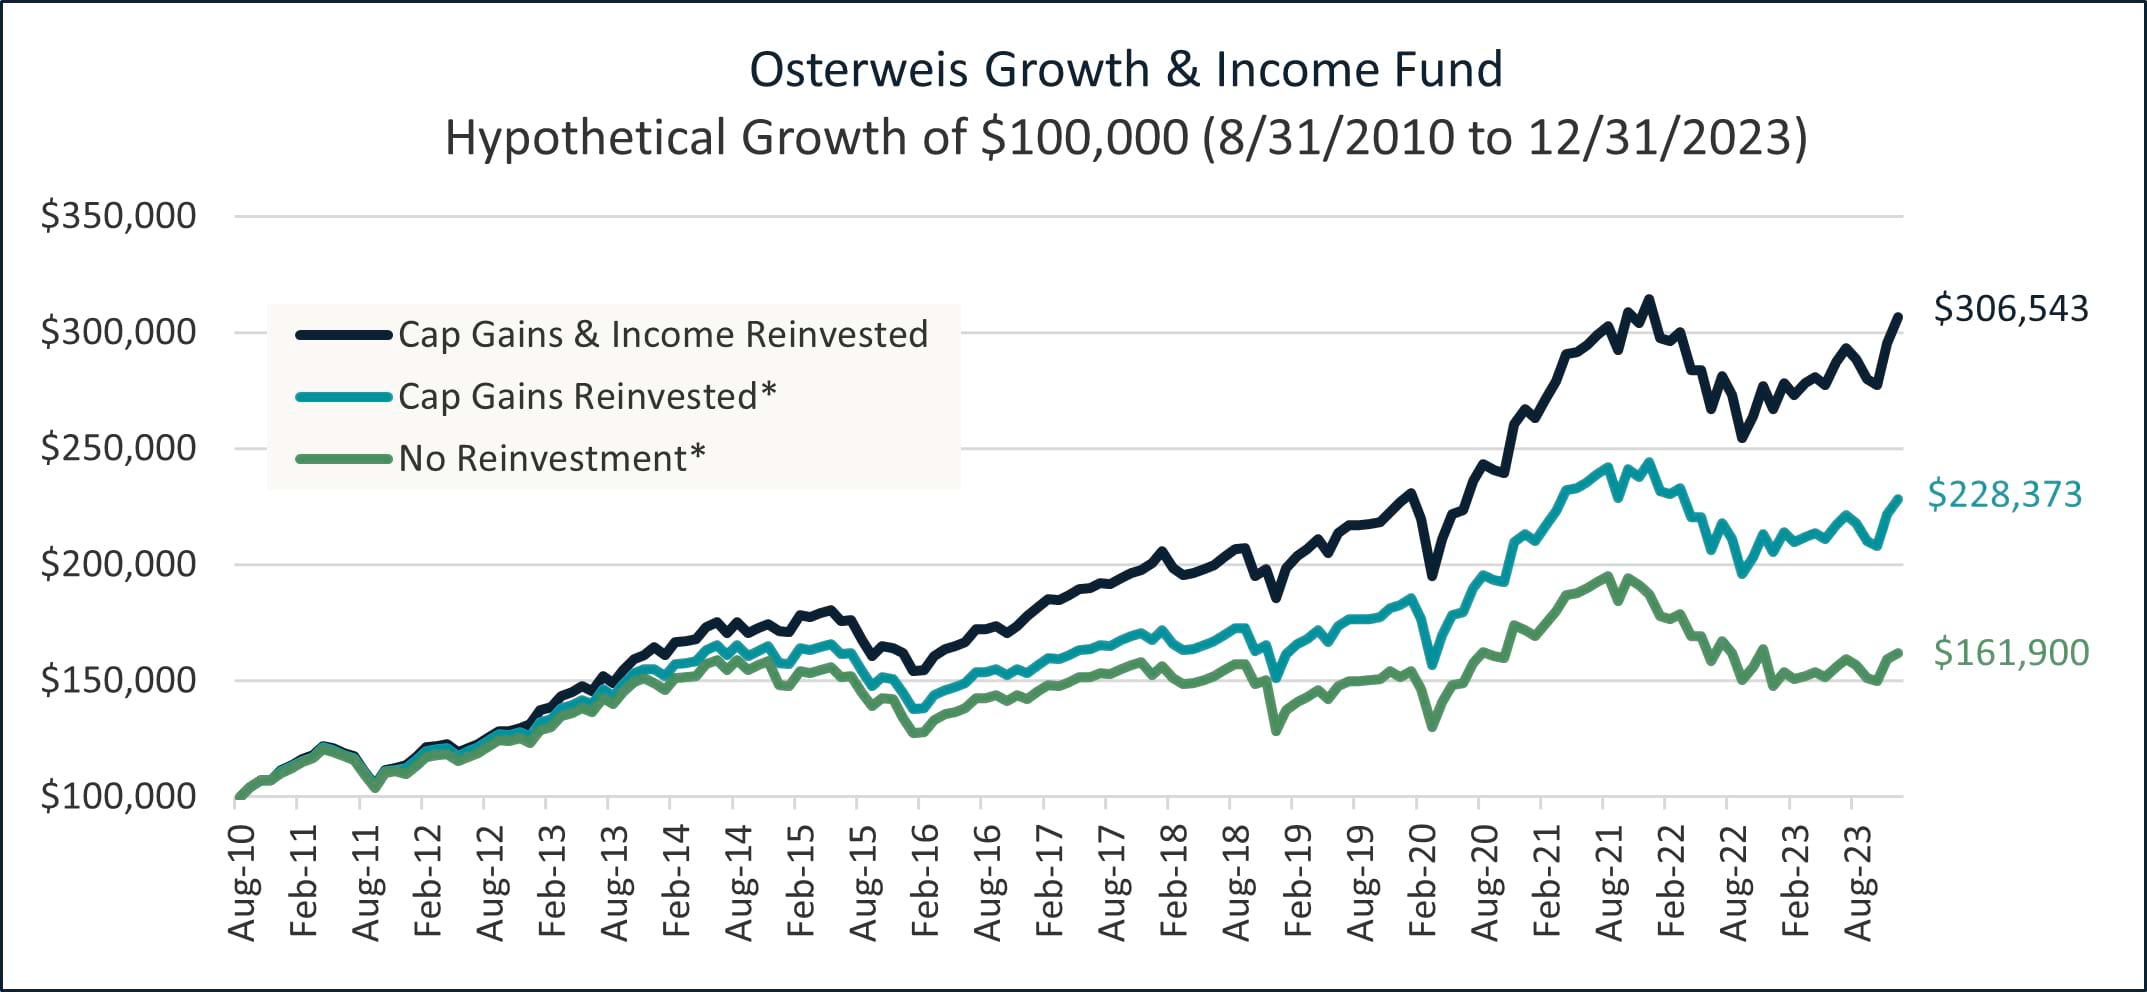
*Cumulative un-reinvested distributions are $49,909 in the Cap Gains Reinvested scenario and $96,225 in the Nothing Reinvested scenario.
Performance data quoted represent past performance; past performance does not guarantee future results. The investment return and principal value of an investment will fluctuate so that an investor's shares, when redeemed, may be worth more or less than their original cost. Current performance of the Fund may be higher or lower than the performance quoted. Performance data current to the most recent month end may be obtained by calling shareholder services toll free at (866) 236-0050.
The above chart illustrates the performance of a hypothetical $100,000 investment made during the period noted above and with different approaches to taking distributions. The chart does not reflect the effect of any applicable sales charge or redemption fees or taxes. During the period noted, fee waivers or expense reimbursements were in effect for the Growth & Income Fund. Source: Osterweis Capital Management
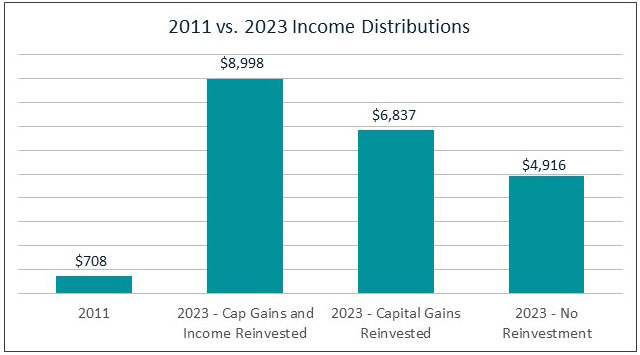
Chart above illustrates the 12-month income generated by a $100,000 investment made at the fund’s inception (8/31/2010) as of 12/31/2011 and as of 12/31/2023 assuming various reinvestment scenarios. Performance data quoted represent past performance; past performance does not guarantee future results. Source: Osterweis Capital Management
Conclusion
We believe that marrying our distinct approaches on the equity and fixed income sides of the portfolio should continue to generate a highly compelling combination of growth and income, allowing all types of clients, including retirees, endowments, foundations, and high net worth families, to achieve their financial objectives. Furthermore, the fund’s lower volatility (compared to a pure equity portfolio) should provide some downside protection during periods of market stress.
John Osterweis
Founder, Chairman & Co-Chief Investment Officer – Core Equity
Carl Kaufman
CIO – Strategic Income & Managing Director – Fixed Income
Nael Fakhry
Co-Chief Investment Officer – Core Equity
Gregory Hermanski
Co-Chief Investment Officer – Core Equity
Featuring


John Osterweis
Founder, Chairman & Co-Chief Investment Officer – Core Equity
John Osterweis founded Osterweis Capital Management to serve the portfolio needs of high-net-worth investors, foundations, and endowments. He is currently Chairman of the firm as well as a member of the firm’s Management Committee and a Portfolio Manager for the core equity, growth & income, and flexible balanced strategies.
After graduating from business school, John served as a Senior Analyst concentrating on the forest products and paper industry for several regional brokerage firms and later for E.F. Hutton & Company, Inc. In addition to his activities as an analyst, John served as Director of Research for two firms and managed equity portfolios for over ten years. In late 1982, John decided to devote himself full time to his portfolio management activities, and in April of 1983 launched Osterweis Capital Management.
John graduated from Bowdoin College (B.A. in Philosophy, cum laude), and Stanford Graduate School of Business (M.B.A. with top honors in Finance).
Outside of his work, John is an active supporter of our community. He has served as Director of the Lucas Museum of Narrative Art, Director on the Stanford Alumni Association Executive Board, Trustee of Bowdoin College, Director and Vice Chairman of Mt. Zion Hospital and Medical Center, and President of the Board of Directors for Summer Search Foundation. He currently serves as a Trustee of the San Francisco Ballet Association, Director of the San Francisco Free Clinic, and President Emeritus of the San Francisco Ballet Endowment Foundation, as well as Trustee Emeritus of Summer Search Foundation and of Bowdoin College. He also enjoys horseback riding and other outdoor activities.


Carl Kaufman
CIO – Strategic Income & Managing Director – Fixed Income
Carl Kaufman has managed the Osterweis Strategic Income Fund since its inception and serves as the Managing Director of Fixed Income, as well as a Portfolio Manager for the Osterweis Growth & Income strategy. He is also a member of the firm’s Management Committee.
He joined Osterweis Capital Management in 2002, after nearly 24 years at Robertson Stephens and Merrill Lynch.
Carl graduated from Harvard University and attended New York University Graduate School of Business Administration.
Outside his professional endeavors, he enjoys playing classical piano and actively contributes to the community as a member of the Board of Trustees for the San Francisco Conservatory of Music, supporting the arts and enhancing the cultural fabric of the SF Bay Area. Additionally, he enjoys playing golf, an activity that continually challenges his patience and precision.


Nael Fakhry
Co-Chief Investment Officer – Core Equity
Nael Fakhry, a partner at Osterweis, is a Portfolio Manager for the core equity, growth & income, quality cyclical growth, and flexible balanced strategies. He loves the process of researching companies and studying the history of various industries.
Prior to joining Osterweis Capital Management in 2011, Nael worked as an Associate at American Securities, a private equity firm, and as an Analyst in the investment banking division of Morgan Stanley.
Nael graduated from Stanford University with a B.A. in History, Phi Beta Kappa and the University of California Berkeley, Walter A. Haas School of Business with an M.B.A., where he was a C.J. White Scholar. Outside of his professional life, Nael enjoys coaching his kids’ soccer and basketball teams, reading, and running. He also contributes to the community as Treasurer and member of the Board of Directors of the Burlingame Community Education Foundation, where he supports local education and helps manage the endowment.


Gregory Hermanski
Co-Chief Investment Officer – Core Equity
Greg Hermanski, a partner at Osterweis, is a Portfolio Manager for the core equity, growth & income, quality cyclical growth, and flexible balanced strategies. He enjoys working with his team to protect and grow our clients’ wealth. Greg feels that humility and discipline are key to succeeding in this industry and loves the continuous chance to learn as part of his role.
Prior to joining Osterweis in 2002, Greg was a Vice President at Robertson Stephens and Co. where he was in charge of convertible bond research. Prior to that, Greg was a Research Analyst covering convertible, high yield, and distressed securities at Imperial Capital, LLC, and a Valuation Consultant for Price Waterhouse, LLC.
Greg graduated from the University of California, Los Angeles with a B.A. in Business/Economics. Outside of work, he enjoys traveling, mountain biking, running, reading, and learning about history.
For more information about this strategy, please send us an email or call us at (800) 700-3316.
Related Insights
Growth & Income Fund Quarter-End Performance (as of 6/30/26)
| Fund | 1 MO | QTD | YTD | 1 YR | 3 YR | 5 YR | 10 YR | 15 YR |
INCEP (8/31/2010) |
|---|---|---|---|---|---|---|---|---|---|
| OSTVX | 1.16% | 8.07% | 5.77% | 11.74% | 11.32% | 6.12% | 9.04% | 8.37% | 9.09% |
| 60% S&P 500 Index/40% Bloomberg U.S. Aggregate Bond Index | -0.47% | 9.31% | 6.45% | 14.76% | 13.92% | 8.10% | 9.98% | 9.62% | 10.17% |
| S&P 500 Index | -0.95% | 15.20% | 10.21% | 22.32% | 20.61% | 13.41% | 15.51% | 14.36% | 15.34% |
| Bloomberg U.S. Aggregate Bond Index | 0.24% | 0.67% | 0.62% | 3.79% | 4.16% | 0.08% | 1.54% | 2.28% | 2.25% |
Gross expense ratio as of 3/31/26: 0.98%
Performance data quoted represent past performance; past performance does not guarantee future results. The investment return and principal value of an investment will fluctuate so that an investor’s shares, when redeemed, may be worth more or less than their original cost. Current performance of the Fund may be higher or lower than the performance quoted. Performance data current to the most recent month end may be obtained by calling shareholder services toll free at (866) 236-0050.
Rates of return for periods greater than one year are annualized.
Where applicable, charts illustrating the performance of a hypothetical $10,000 investment made at a Fund’s inception assume the reinvestment of dividends and capital gains, but do not reflect the effect of any applicable sales charge or redemption fees. Such charts do not imply any future performance. During the period noted, fee waivers or expense reimbursements were in effect for the Growth & Income Fund.
Source for any Bloomberg index is Bloomberg Index Services Limited. BLOOMBERG® is a trademark and service mark of Bloomberg Finance L.P. and its affiliates (collectively “Bloomberg”). Bloomberg owns all proprietary rights in the Bloomberg Indices. Bloomberg does not approve or endorse this material, or guarantees the accuracy or completeness of any information herein, or makes any warranty, express or implied, as to the results to be obtained therefrom and, to the maximum extent allowed by law, neither shall have any liability or responsibility for injury or damages arising in connection therewith.
The 60/40 blend is composed of 60% S&P 500 Index (S&P) and 40% Bloomberg U.S. Aggregate Bond Index (Agg) and assumes monthly rebalancing. The S&P is widely regarded as the standard for measuring large cap U.S. stock market performance. The Agg is widely regarded as a standard for measuring U.S. investment grade bond market performance. These indices do not incur expenses and are not available for investment. These indices include reinvestment of dividends and/or interest income.
References to specific companies, market sectors, or investment themes herein do not constitute recommendations to buy or sell any particular securities.
There can be no assurance that any specific security, strategy, or product referenced directly or indirectly in this commentary will be profitable in the future or suitable for your financial circumstances. Due to various factors, including changes to market conditions and/or applicable laws, this content may no longer reflect our current advice or opinion. You should not assume any discussion or information contained herein serves as the receipt of, or as a substitute for, personalized investment advice from Osterweis Capital Management.
Complete holdings of all Osterweis mutual funds (“Funds”) are generally available ten business days following quarter end. Holdings and sector allocations may change at any time due to ongoing portfolio management. Fund holdings as of the most recent quarter end are available here: Growth & Income Fund
Opinions expressed are those of the authors, are subject to change at any time, are not guaranteed and should not be considered investment advice.
Standardized performance is available here.
Performance data quoted represent past performance; past performance does not guarantee future results. The investment return and principal value of an investment will fluctuate so that an investor’s shares, when redeemed, may be worth more or less than their original cost. Current performance of the Fund may be higher or lower than the performance quoted. Performance data current to the most recent month end may be obtained by calling (866) 236-0050. An investment should not be made solely on returns. The Fund’s gross expense ratio was 0.97% as of March 31, 2022.
The Osterweis Funds are available by prospectus only. The Funds’ investment objectives, risks, charges, and expenses must be considered carefully before investing. The summary and statutory prospectuses contain this and other important information about the Funds. You may obtain a summary or statutory prospectus by calling toll free at (866) 236-0050, or by visiting www.osterweis.com/statpro. Please read the prospectus carefully before investing to ensure the Fund is appropriate for your goals and risk tolerance.
Mutual fund investing involves risk. Principal loss is possible. The Osterweis Growth & Income Fund may invest in small- and mid-capitalization companies, which tend to have limited liquidity and greater price volatility than large-capitalization companies. The Fund may invest in foreign and emerging market securities, which involve greater volatility and political, economic and currency risks and differences in accounting methods. These risks may increase for emerging markets. The Fund may invest in debt securities that are un-rated or rated below investment grade. Lower-rated securities may present an increased possibility of default, price volatility or illiquidity compared to higher-rated securities. Investments in debt securities typically decrease in value when interest rates rise. From time to time, the Fund may have concentrated positions in one or more sectors subjecting the Fund to sector emphasis risk. Investments in asset-backed and mortgage-backed securities include additional risks that investors should be aware of such as credit risk, prepayment risk, possible illiquidity and default, as well as increased susceptibility to adverse economic developments.
Diversification does not assure a profit, nor does it protect against a loss in a declining market.
The Bloomberg U.S. Aggregate Bond Index (Agg) is widely regarded as a standard for measuring U.S. investment grade bond market performance.
ICE BofA U.S. High Yield Index tracks the performance of U.S. dollar denominated below-investment grade corporate debt publicly issued in the U.S. domestic market. This index reflects transaction costs.
The S&P 500 Index is an unmanaged index that is widely regarded as the standard for measuring large-cap U.S. stock market performance.
Free cash flow represents the cash that a company is able to generate after laying out the money required to maintain and expand the company’s asset base. Free cash flow is important because it allows a company to pursue opportunities that enhance shareholder value.
The downside market capture ratio is calculated by dividing the portfolio’s return when the benchmark (Bloomberg U.S. Aggregate) performance is negative by the return of the benchmark during the same periods.
The upside market capture ratio is calculated by dividing the portfolio’s return when the benchmark (Bloomberg U.S. Aggregate) performance is positive by the return of the benchmark during the same periods.
Yield is the income return on an investment, such as the interest or dividends received from holding a particular security.
Dividend yield is the income return on an investment related specifically to dividends.
Lipper’s High Yield Funds peer group classification includes funds that aim at high (relative) current yield from fixed income securities, have no quality or maturity restrictions, and tend to invest in lower-grade debt issues.
eVestment Alliance, LLC and its affiliated entities (collectively, “eVestment”) collect information directly from investment management firms and other sources believed to be reliable; however, eVestment does not guarantee or warrant the accuracy, timeliness, or completeness of the information provided and is not responsible for any errors or omissions. Performance results may be provided with additional disclosures available on eVestment’s systems and other important considerations such as fees that may be applicable. Not for general distribution and limited distribution may only be made pursuant to client’s agreement terms. * All categories not necessarily included, Totals may not equal 100%. Copyright 2012-2023 eVestment Alliance, LLC. All Rights Reserved.
Any tax or legal information provided is merely a summary of our understanding and interpretation of some of the current income tax regulations and is not exhaustive. Investors must consult their tax advisor or legal counsel for advice and information concerning their particular situation. Neither the Fund nor any of its representatives may give legal or tax advice.
Osterweis Capital Management is the adviser to the Osterweis Funds, which are distributed by Quasar Distributors, LLC. [OCMI-461017-2023-11-22]
