Abstract
Over 60% of capital currently allocated to small cap stocks is invested in passive vehicles, but historical data unequivocally shows that there is more opportunity for alpha (i.e., market outperformance) in small caps than in any other segment of the publicly traded equity markets.
In this paper, we explain that this persistent outperformance is due to structural advantages in the small cap market, rather than luck or random chance. Specifically, it is less efficient than either the mid or large cap markets, and it possesses a higher volume of rapidly growing companies than those other markets.
We also provide several long-term historical charts demonstrating that managers have consistently had more success generating alpha in the small cap market than in the large or mid cap markets.
Finally, we briefly discuss why favorable valuations make small caps attractive in the current environment.
Looking for Alpha in All the Wrong Places
Passive strategies have been taking market share from actively managed funds for decades, and the trend is most pronounced for small caps. Currently, 62% of small cap funds are passive, compared to 40% in 2014. Large caps have the next highest proportion, at 58%, while just 44% of mid cap funds are passive.
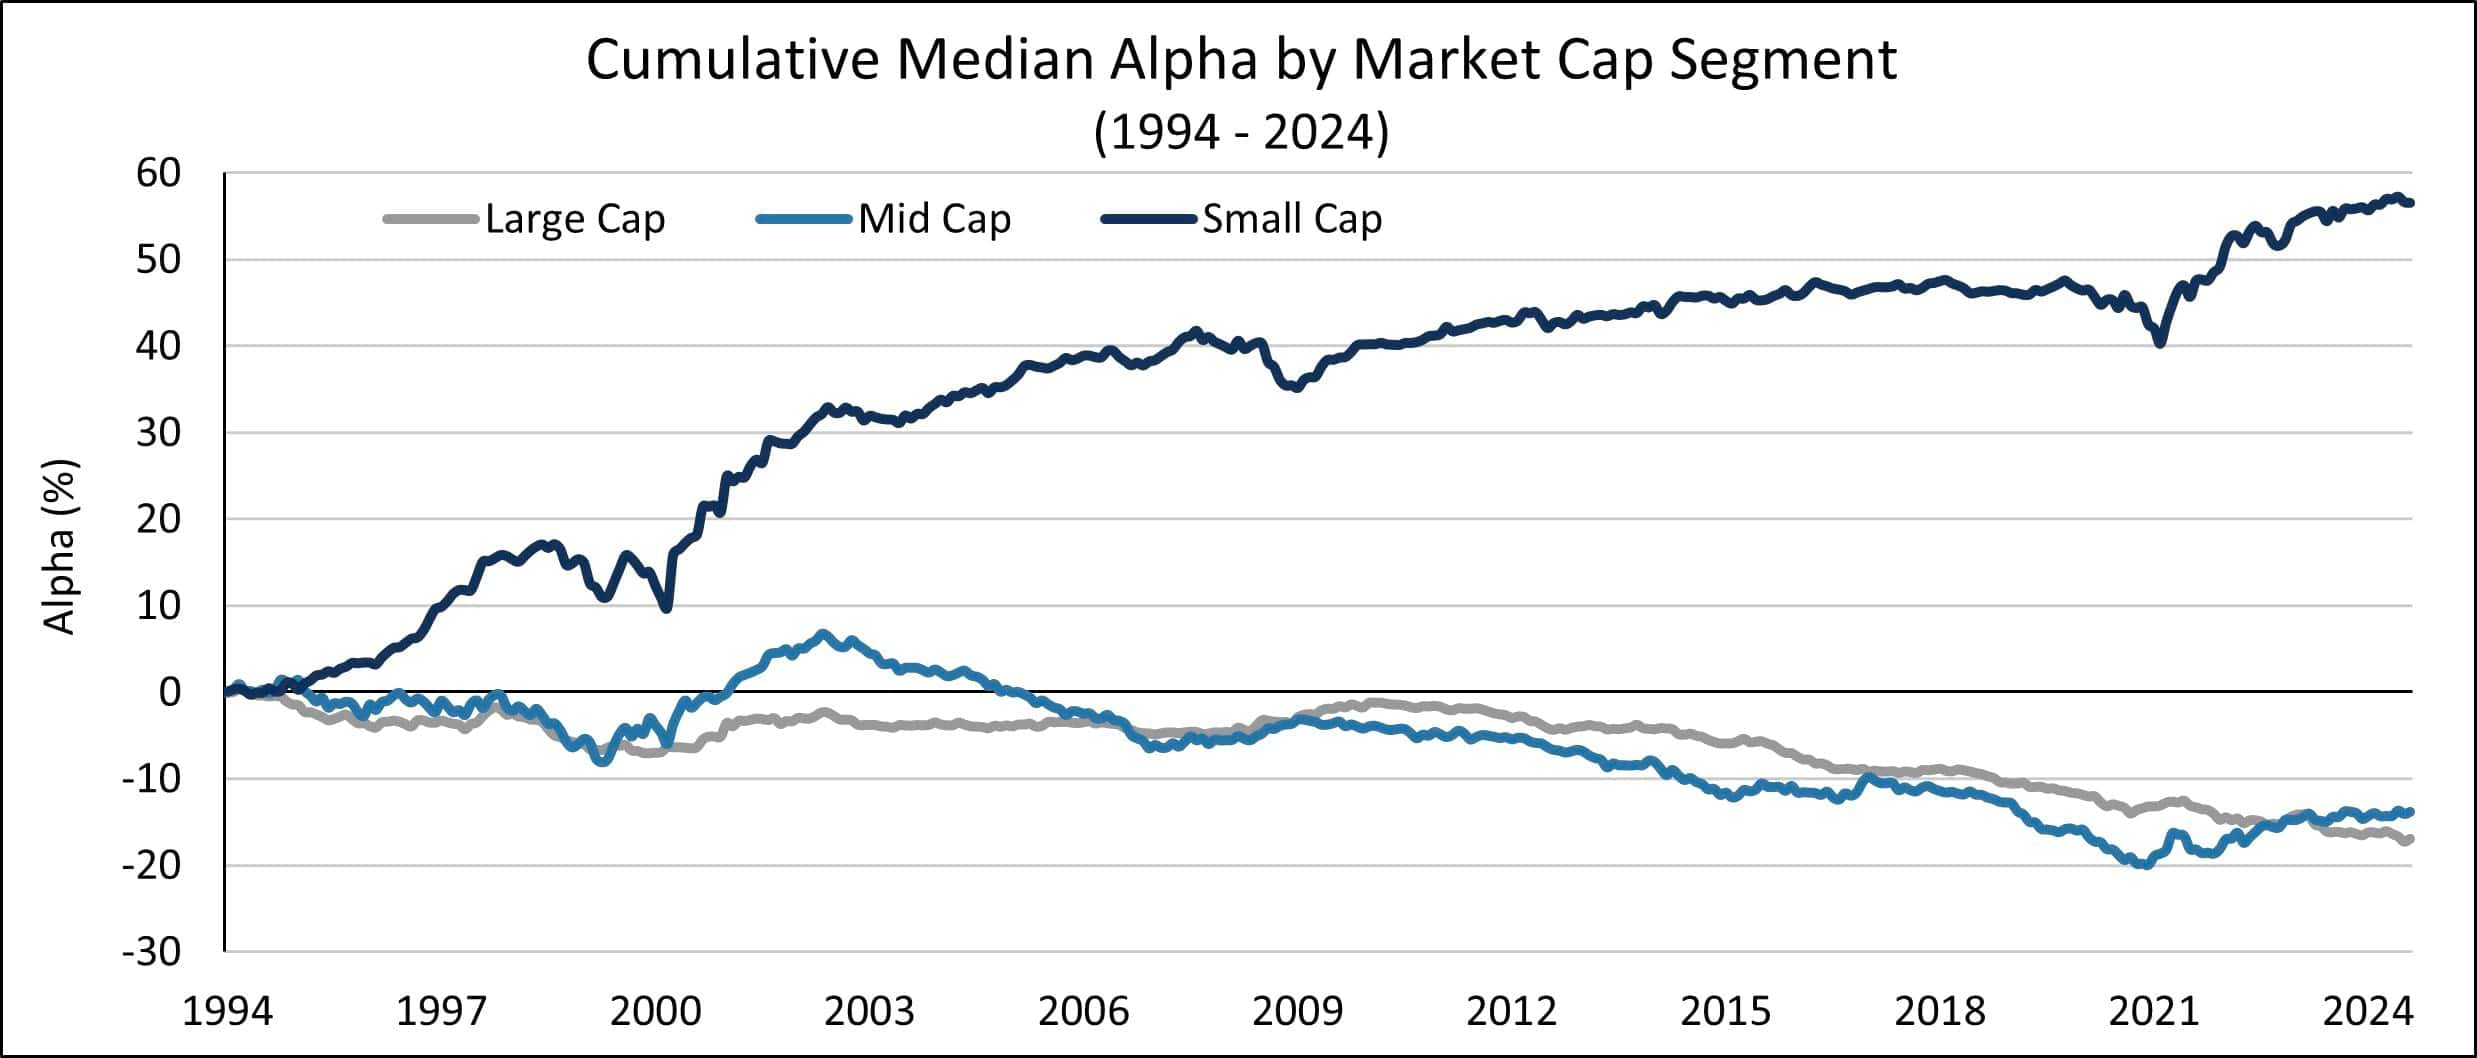
In our view, investors who opt for passive small cap exposure are making a costly error, as they are ignoring one of the most reliable sources of alpha available in the public markets. Historical data consistently shows that small cap managers have outperformed their benchmarks by a materially wider margin than either large or mid cap managers. The chart below from Morgan Stanley quantifies the cumulative alpha produced by small cap managers versus mid and large cap managers over roughly the past 30 years, and the results are clear. (Note that this is just one of multiple corroborating data points we will discuss in this paper.)
Past performance does not guarantee future results.
We strongly believe that this persistent outperformance is due to structural advantages in the small cap market and that manager skill contributes to small cap alpha generation far more than luck or random chance.
An Inefficient Market
One major reason that small cap managers have more success outperforming their benchmarks is that the small cap market is generally less efficient than other segments of the equity market. This means a greater proportion of securities are mispriced, which creates opportunities for managers to find promising companies at discounted valuations.
Lighter Analyst Coverage
Perhaps the biggest reason the small cap market is less efficient is that analyst coverage is consistently lighter than in either the large or mid cap markets.
When a company has many analysts reviewing its financials and regularly meeting with senior leadership, much more is known about its growth potential as well as its challenges. That information is available to managers, who generally use it as a starting point for their own research.
But for companies that lack that level of coverage, particularly if they are younger with shorter track records, managers have to do much more independent analysis. Each manager uses their own approach and prioritizes different attributes, and they can arrive at starkly divergent conclusions about a company’s prospects. (Note that we have previously written about the implications of lighter analyst coverage.)
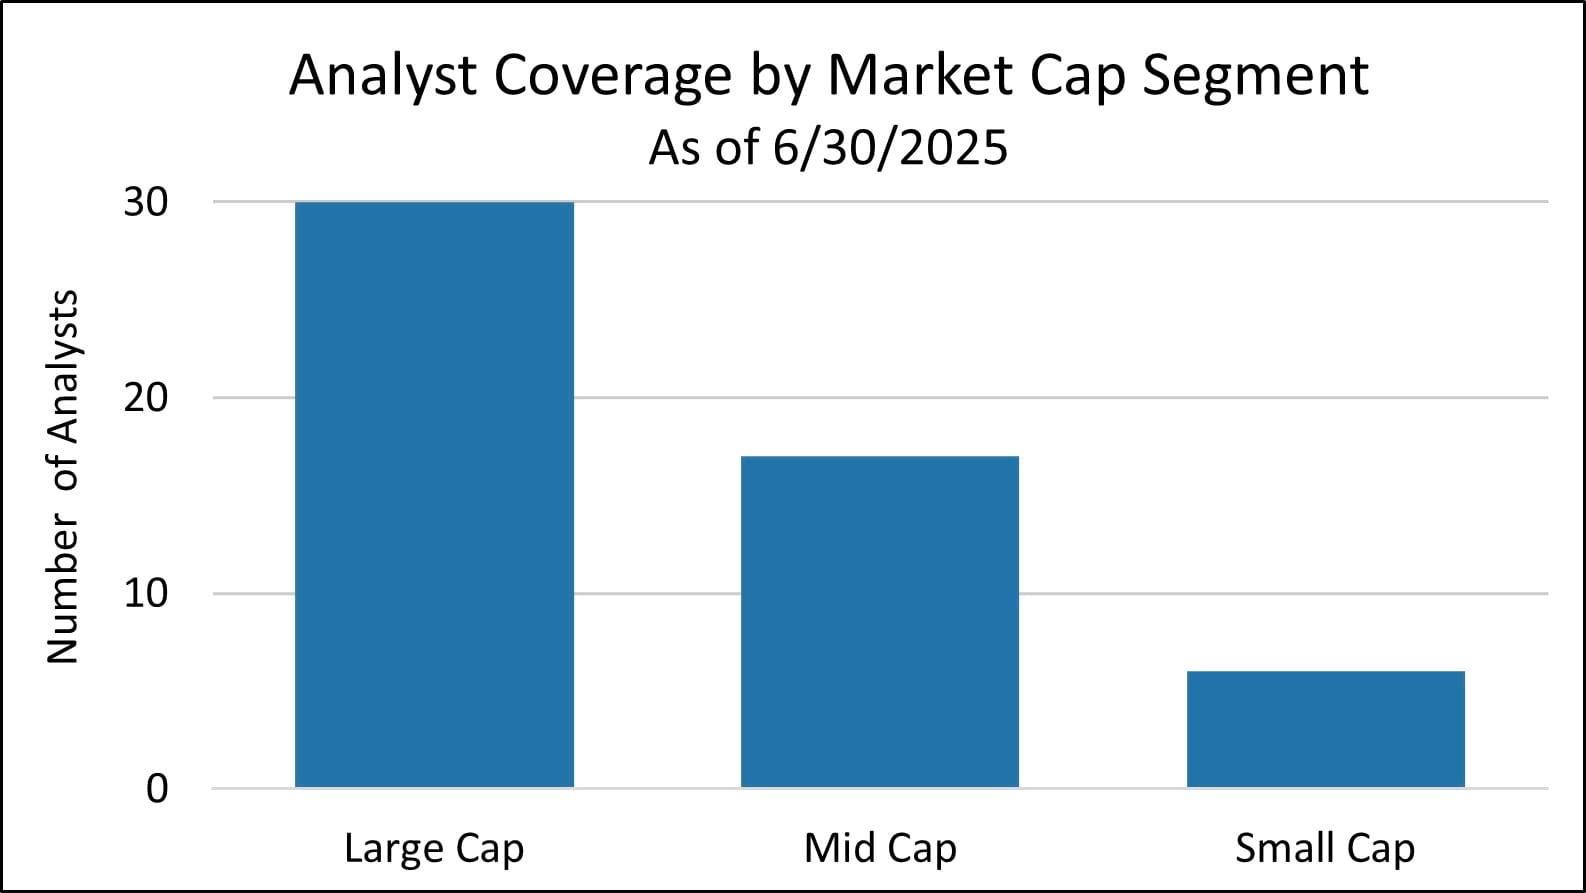
The chart below shows the average number of analysts per stock for the large, mid, and small cap sectors. As you can see, small caps have six per company, compared to 17 and 30 for mid and large caps, respectively. Also, this relationship is quite stable. According to Bank of America, in 1999 the numbers were nearly identical to today.
Underappreciated Upside Potential
Another reason the small cap market is less efficient is that smaller companies are frequently innovative businesses that produce novel products that do not yet exist in the marketplace, which makes it more challenging to estimate how strong demand will be for their goods and services. Managers who identify adoption trends early are often able to generate strong returns as other investors eventually follow the crowd and drive up the share price.
One good example is a company called Insulet (PODD), which we used to own. The company was the first in the industry to offer disposable insulin pumps that could be controlled through a smartphone app. Previously, patients either needed to administer insulin shots manually, or wear an attached pump that required cumbersome tubing.
A tubeless, disposable system was certainly an appealing idea, as it simplified the insulin delivery process. But when it was new, it was still unproven, and adoption was slow. Moreover, the company was aggressively scaling up its marketing efforts to attempt to take share from incumbents, so it was losing money even as revenues were growing.
Investors were skeptical at first, and the company’s stock did not do much for the first several years after its 2007 IPO. But those who recognized the potential early were rewarded for their patience. Starting around 2016, the technology began to gain significant traction and demand surged, which sent the share price soaring.
This type of upside is more common in small caps than mid or large caps, as most larger companies are well established, so expectations about their future growth rates are less varied.
Misunderstood Models
In addition, many small cap companies fly under the radar while they reinvent their business models. Skilled managers who find these opportunities before they are widely discovered are generally rewarded with excellent returns.
An example of this came about recently in our portfolio with an aerospace company called FTAI Aviation (FTAI). The company started out as a traditional lessor of jet engines, but over time it added a maintenance and repair business that proved to be faster growing and more lucrative. FTAI pioneered a technique for refurbishing engines called a “module swap,” where they break down used engine components into standalone modules that can be installed quickly. The process is significantly simpler and faster for the customer, who previously needed to take their planes offline for much longer while the engines were in the shop.
From its IPO in 2015 through 2022, while the company was primarily a lessor, FTAI’s stock did not move much. But once the market began to notice the positive effects of the repair business and the strong increase in customer demand, its share price took off, rallying for almost 24 straight months.
This scenario is more common among small caps because these kinds of changes have a larger proportional impact on revenues. Bigger companies can add a division or make a strategic acquisition to increase growth, but typically the effect will be marginal relative to the overall revenue stream. For a smaller business like FTAI, this type of pivot can change the company’s entire financial profile.
A Target-Rich Environment
Not only is the market for small caps less efficient, but it also tends to contain a higher number of companies that are capable of outperforming. There are two main reasons for this. First, the small cap market is much bigger than the mid and large cap markets (i.e., it has many more individual companies), so it contains more businesses with attractive fundamentals. Second, there is a greater dispersion of returns between the stronger and weaker companies, which means managers who correctly identify winners will have a bigger performance advantage over the benchmark.
A Blend of Quantity and Quality
For the past 15 years, small caps have consistently produced more rapidly growing, profitable firms than other markets.
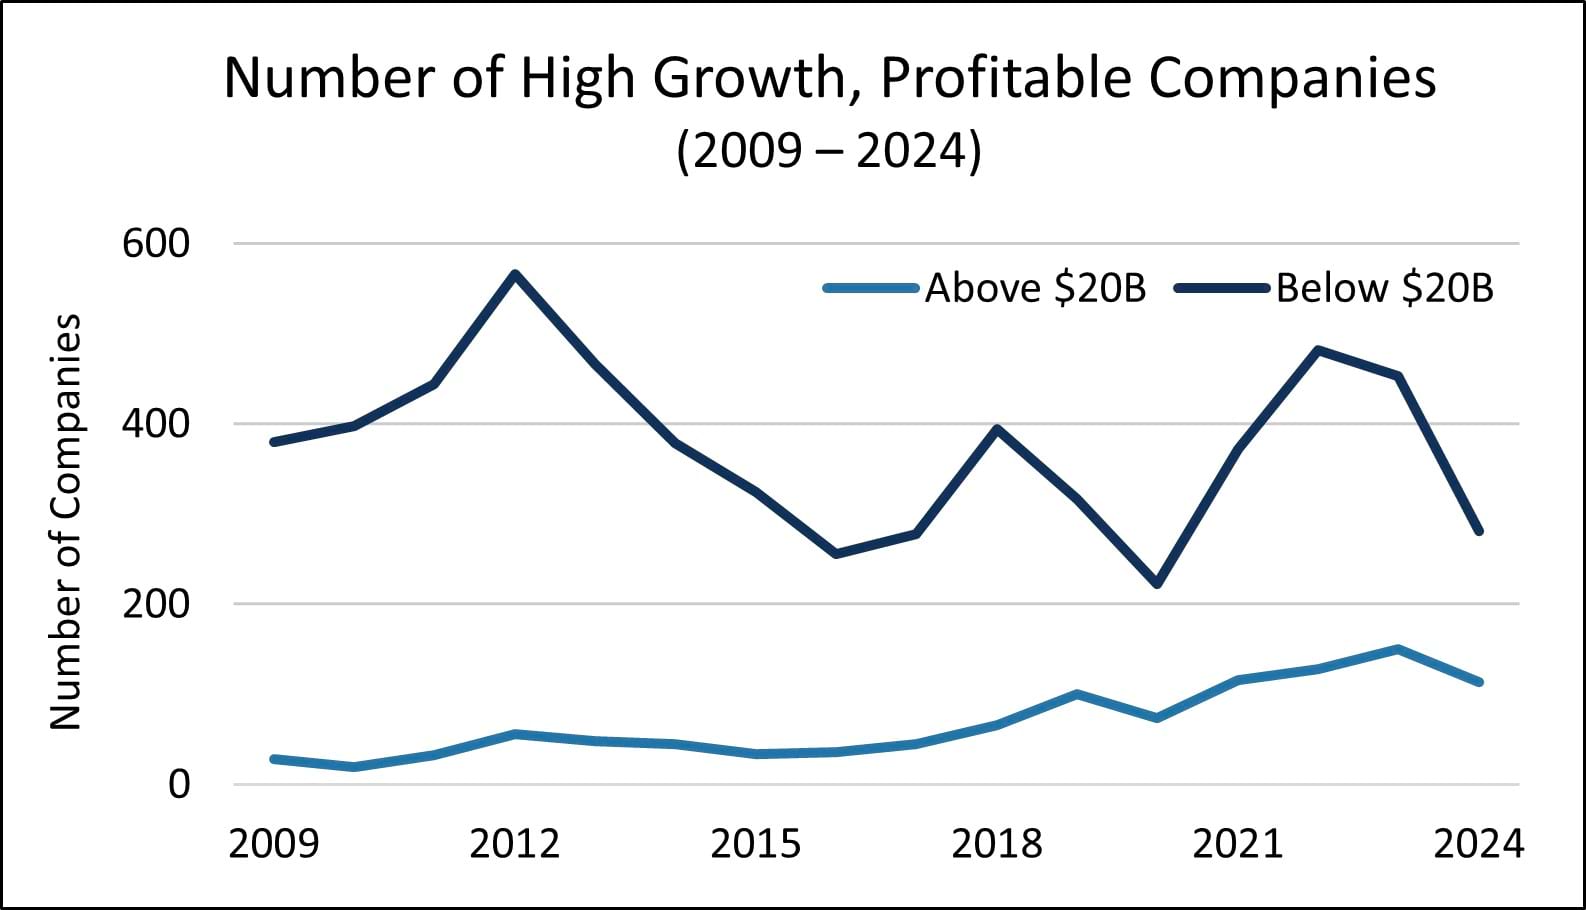
As you can see from the chart below, there are significantly more companies with a combination of high sales growth and high profitability (both above 7%) below $20 billion than above. (Note that the vast majority of the positions in our portfolio are below $20 billion.)
Past performance does not guarantee future results.
Looking at top-line growth and profitability together typically paints a clearer picture about a company’s prospects than looking at either metric in isolation. A fast-growing company that is not profitable could operate an inherently low-margin business that cannot benefit from economies of scale, regardless of how large it becomes. Alternatively, a profitable company that is slow growing may never achieve the level of demand required to generate rapid top-line growth.
As mentioned above, the small cap universe contains far more companies than the other market segments, which is why there are so many more attractive opportunities. It also helps explain why small cap managers are more likely to outperform their benchmarks. To borrow a sports reference, there are more shots on goal.
Broad Dispersion of Returns
Another feature of the small cap market is that it typically produces a much wider dispersion of returns between the top and bottom performers than exists in the large cap market. As you can see in the chart below, the spread between the rolling 12-month returns of the top and bottom performers is materially higher for the Russell 2000 index than for the S&P 500.
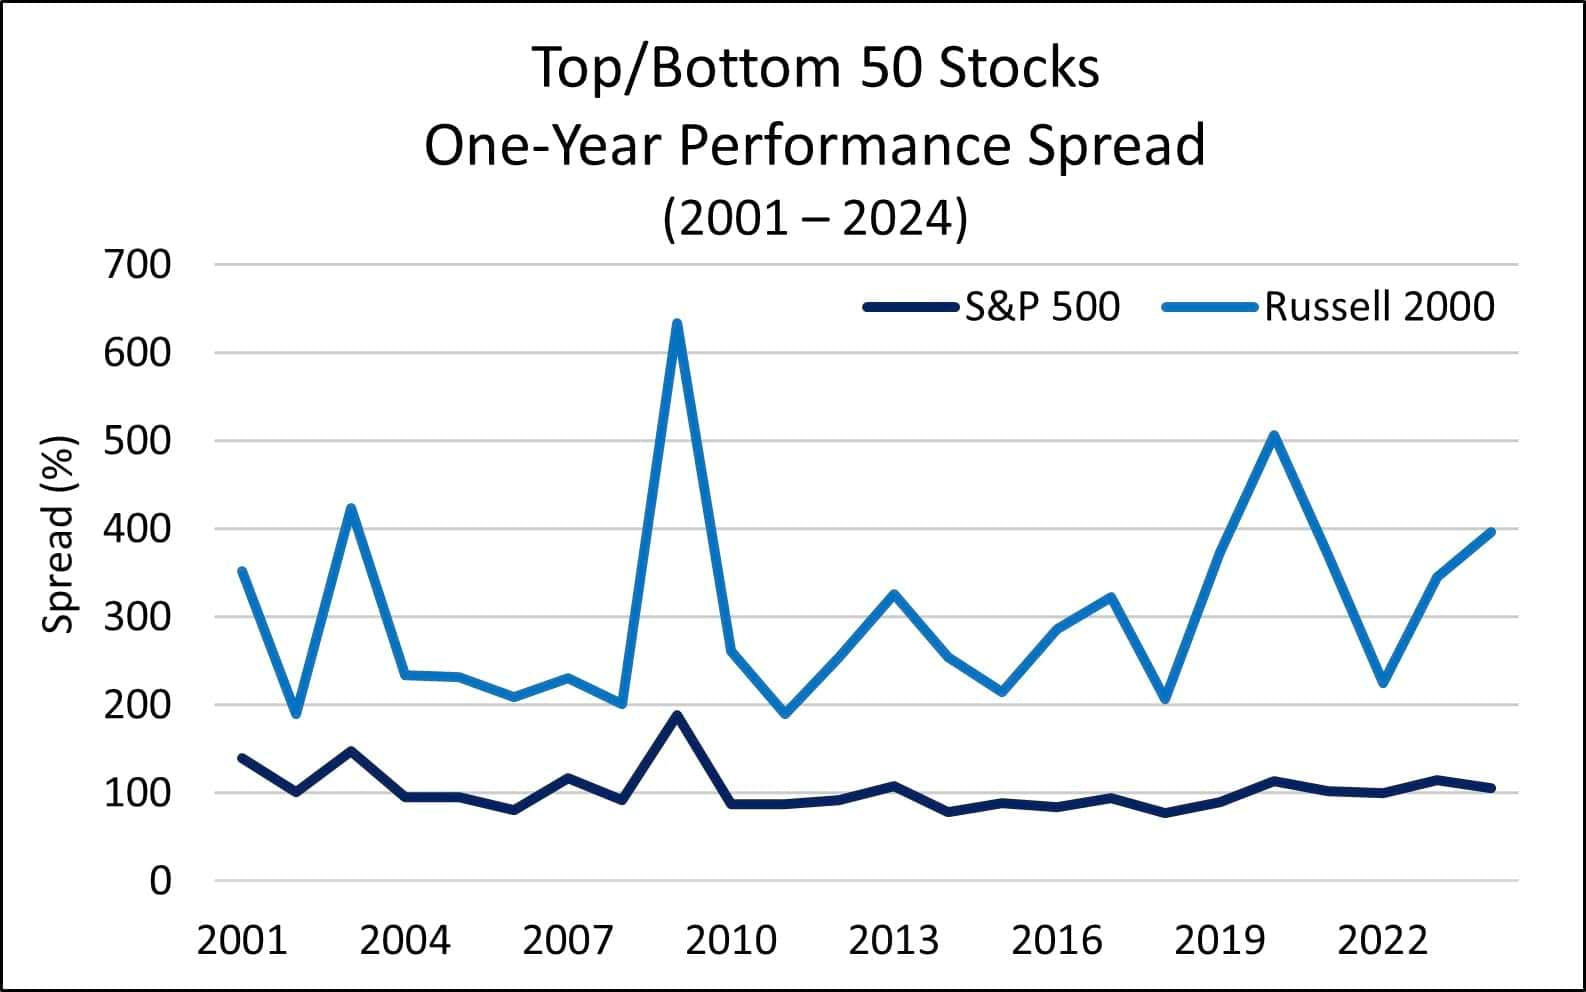
This suggests not only that the stronger small cap companies are generating higher returns than the stronger large cap companies, but the weaker ones are likely lagging more than the large cap laggards. In other words, the small cap index is being dragged down more by the poor performers than the large cap index is, so small cap managers who simply avoid those stocks will be in a better position to beat their benchmark.
Historical Data is Consistent
Historical performance data unequivocally shows that managers have had more success generating alpha in the small cap market than in the large or mid cap markets. In this section we review several different data points that tell the same basic story.
First, as we discussed earlier, according to Morgan Stanley, small caps have generated substantially more alpha than large and mid caps over the past three decades. That chart is rather striking and makes the point quite clearly – the cumulative outperformance of the median manager in the small cap market is nearly 60%, while their large and mid cap counterparts have each lagged their benchmarks by roughly 15%.
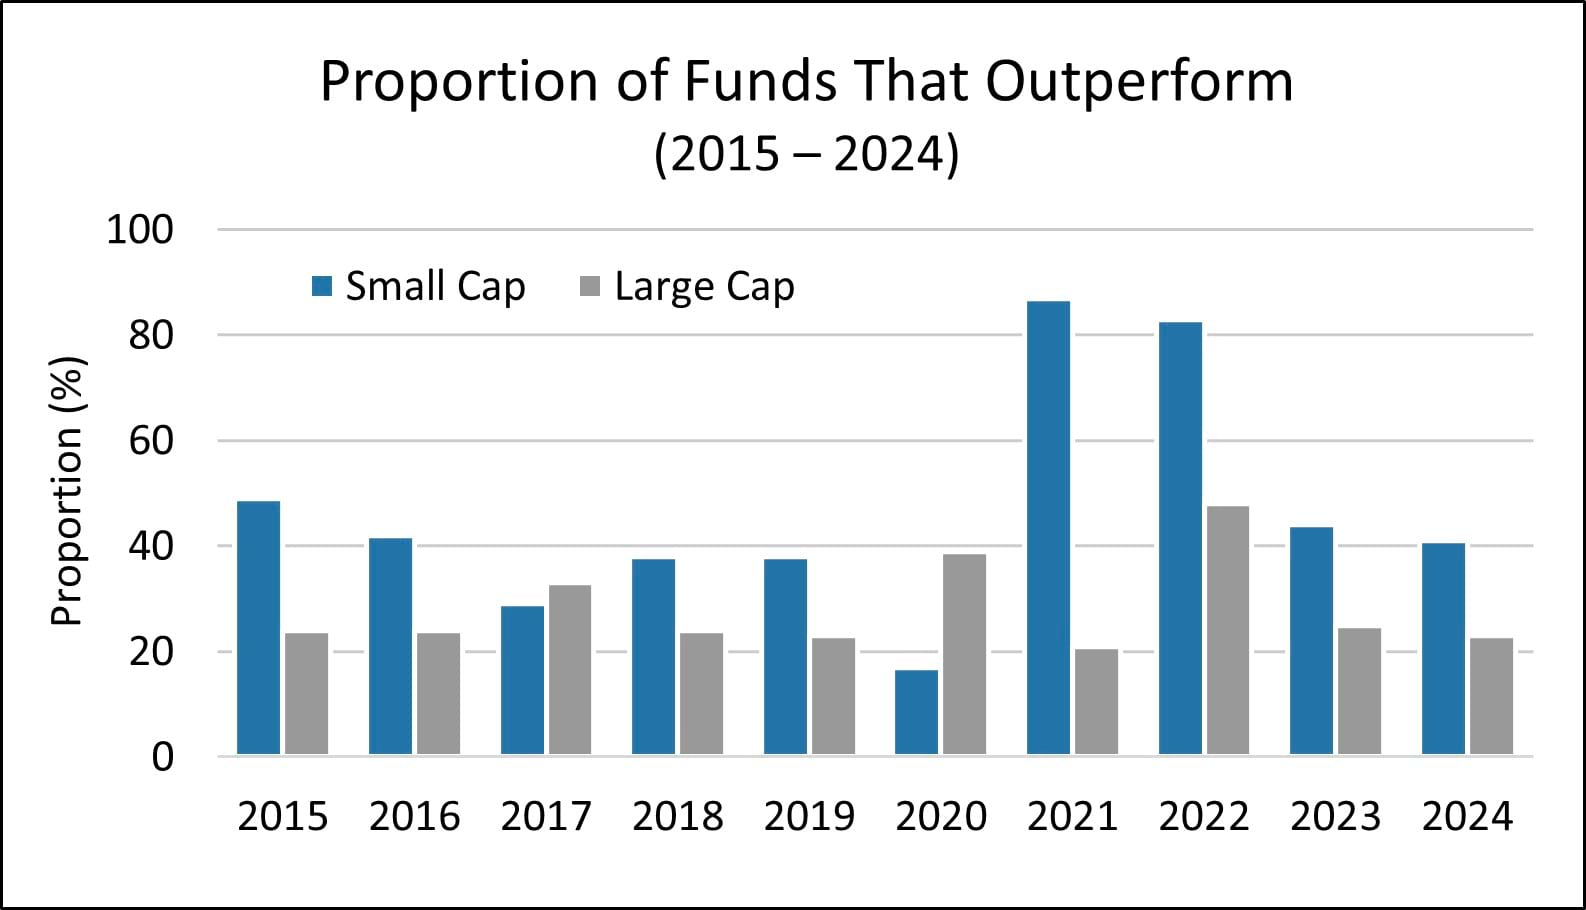
Looking at a shorter time horizon, in eight of the past ten years, a higher percentage of small cap managers have outperformed their benchmark than large cap managers.
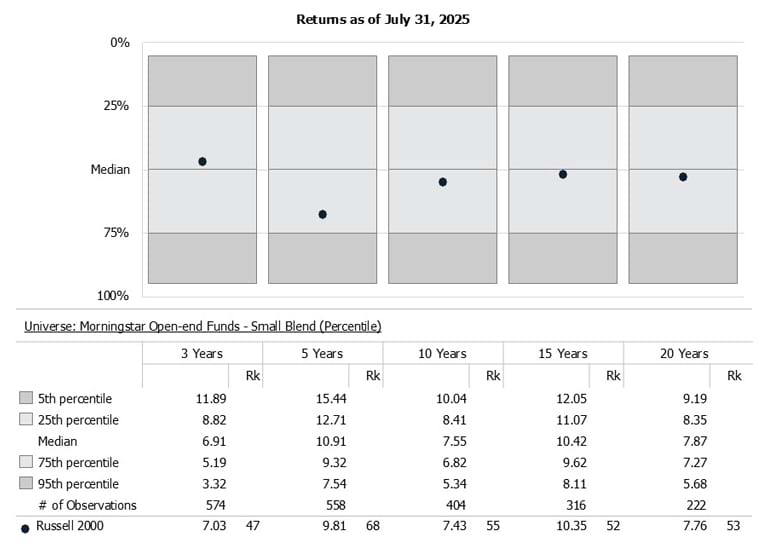
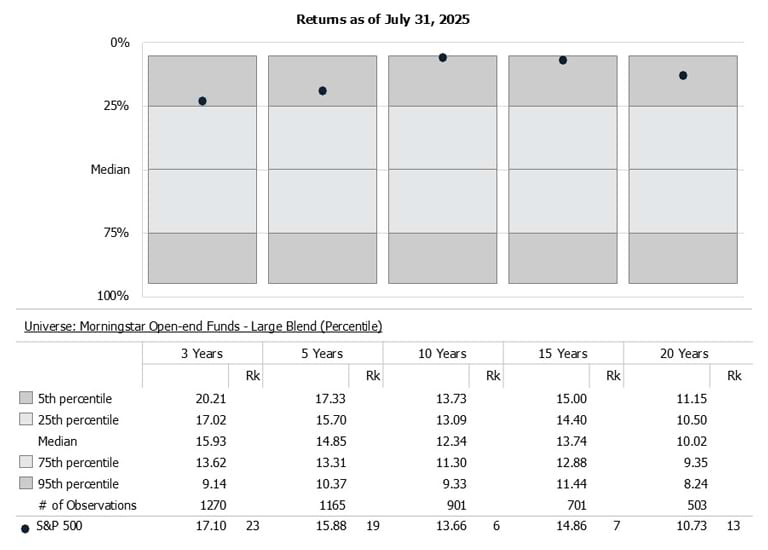
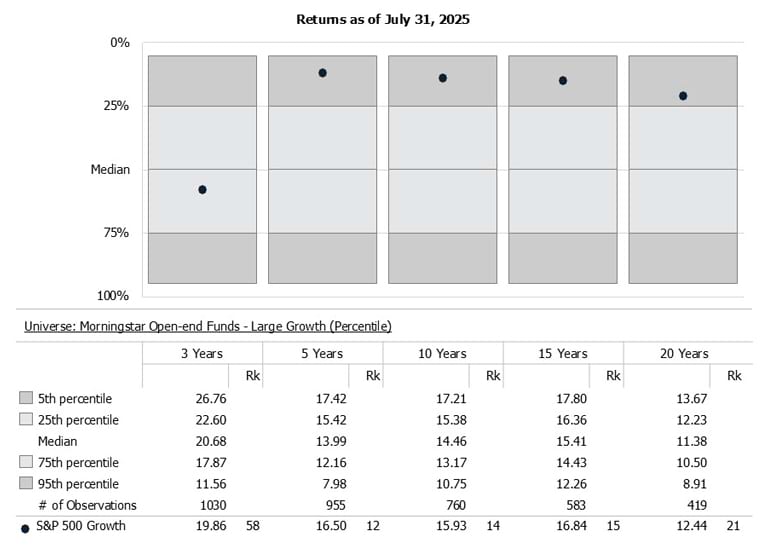
The next set of charts presents the data a little differently, but the results are the same. The dot within each bar is the index return for each time horizon, and the area above the dot indicates the percentage of active managers that have outperformed the index.
The first pair of charts below shows small cap blend managers vs. large cap blend managers. As you can see, essentially half or more of actively managed small cap funds outperform in all time horizons, and in the five-year category, nearly 70% of managers outperformed. Conversely, in the large cap universe, less than 25% of actively managed funds have been able to outperform in any time period, and in the 10-year and 15-year categories, less than 7% were able to do it.
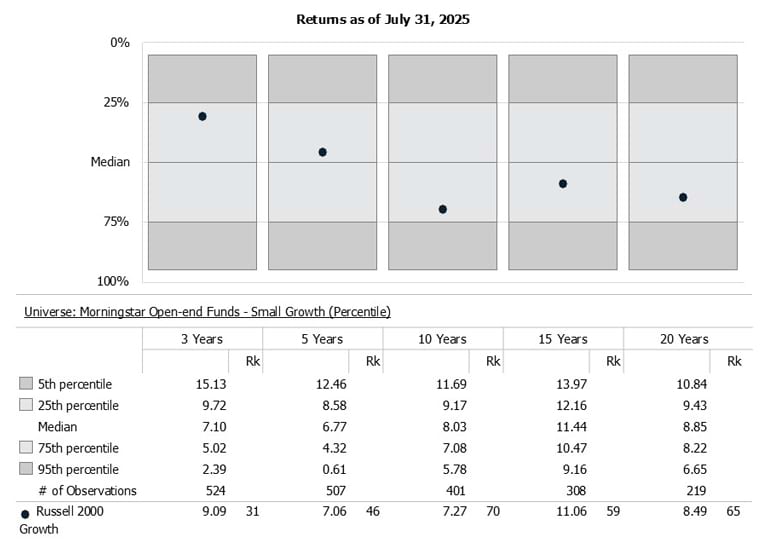
In the next pair, we compare small cap growth managers to large cap growth managers. As you can see, small cap growth managers have fared even better relative to the index than small cap blend managers, particularly over longer horizons. In the 10-, 15-, and 20-year categories, 70%, 59%, and 65% of actively managed funds outperformed the index.
While large cap growth managers performed a little better relative to index than their blended counterparts, still only a small fraction outperformed beyond the 3-year period.
Final Thoughts
The historical data clearly shows that small cap stocks have provided investors with the best opportunity to generate alpha over the past few decades, which we believe is due to the structural advantages we have discussed above.
In addition, data from Bank of America shows that since 1925, small caps have delivered close to 16% annually, while mid caps and large caps have delivered 14% and 12%, respectively. In other words, small caps have historically delivered not only the best relative performance, but also the best absolute performance.
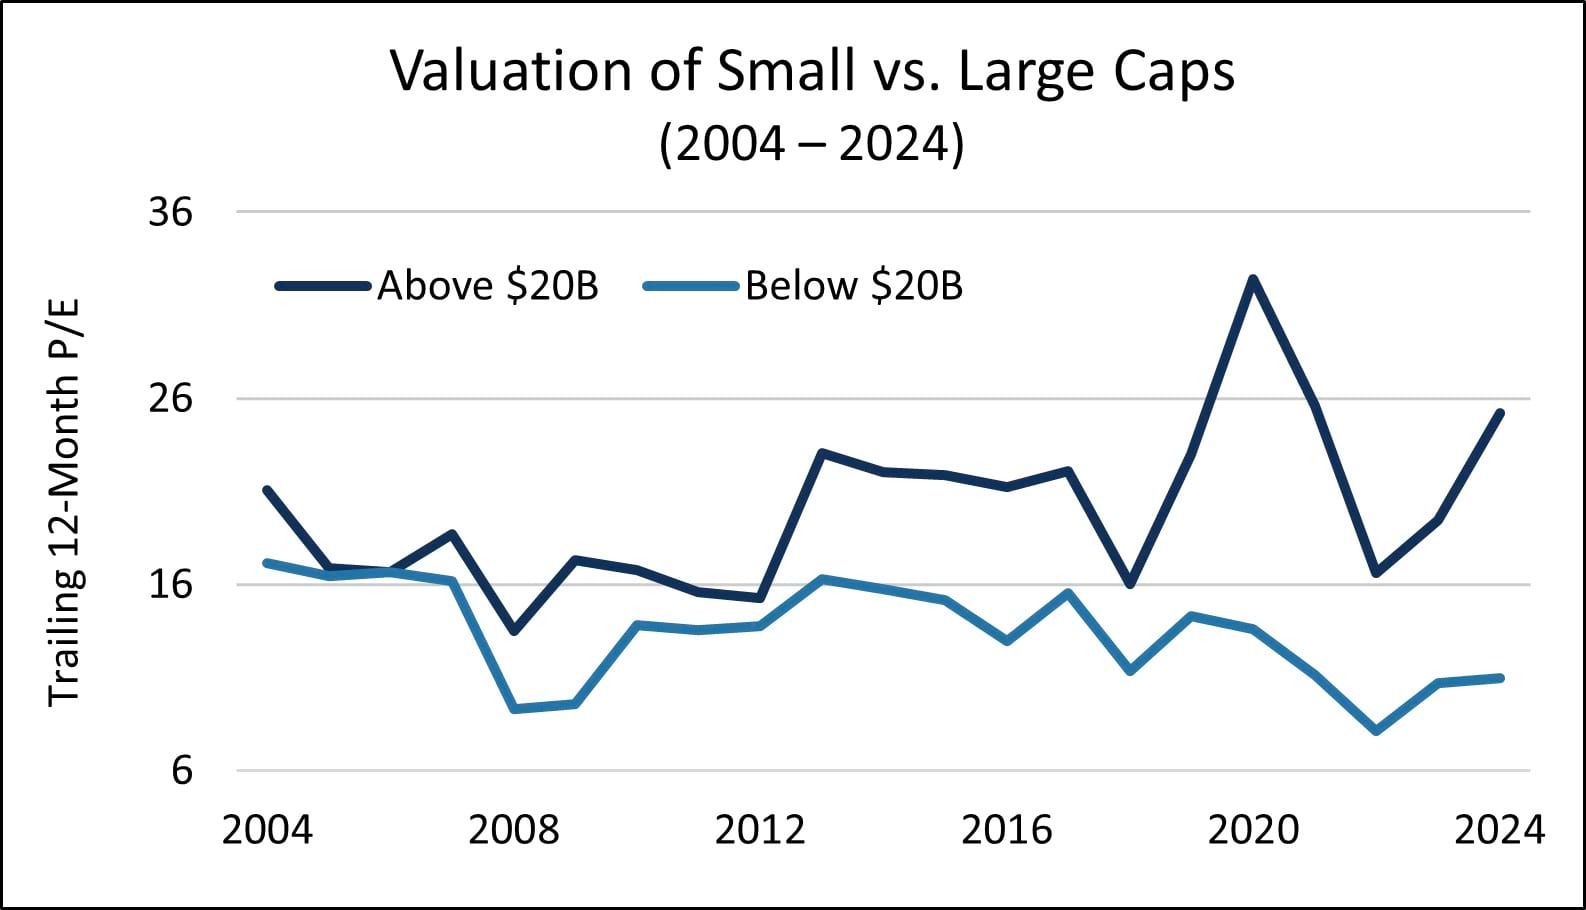
Nonetheless, successful investing is about looking forward, not backward, as we all know that past performance does not guarantee future returns. Fortunately, we believe that the small cap market is particularly attractive right now, as valuations have been falling relative to large caps for the past several years. Below we have plotted the average P/E ratio of fast growing, profitable companies above and below $20 billion for the past 20 years, and you can see that the gap between them has been growing wider since roughly 2018.
Past performance does not guarantee future results.
All else equal, we believe equity investors should prefer stocks when their multiples are lower as they have historically demonstrated greater resilience during periods of market stress and are more inclined to deliver long-run price gains because their multiples still have room to expand. This is particularly true for high quality growth companies.
In summary, we believe there is a plethora of evidence suggesting not only that small cap investors should utilize active strategies, but also that they should feel comfortable allocating to small caps in the current market environment.
Featuring


James Callinan, CFA
Co-CIO – Small Cap Growth & Portfolio Manager
Jim Callinan, a partner at Osterweis, is a Portfolio Manager for the small cap growth strategy. Throughout his career he has focused on investing in companies that are early in their growth cycles. This experience has been the foundation of our high conviction, valuation-aware approach to investing in small cap growth companies.
Prior to Osterweis, Jim was the Co-Founder & Chief Investment Officer at RS Investments. He also founded the RS Growth Group LLC in 1996 and managed the RS Emerging Growth Fund from 1996 until 2010. In 1999 Jim was named Morningstar’s Domestic Stock Manager of the Year.*
Jim served as portfolio manager for the Putnam OTC Emerging Growth Fund from 1994 to 1996 and began his career at Putnam Investments as an equity research analyst in 1987. He joined Osterweis in 2016 and brought with him the Emerging Growth Partners, LP, a concentrated small cap growth strategy he founded at RS in 2006.
Jim graduated from Harvard College with a B.A. in Economics, New York University with an M.S. in Accounting, and Harvard Business School with an M.B.A. He holds the CFA designation and is a member of the Weatherbie Capital Advisory Board. Outside of work, Jim enjoys spending time with his family, travelling, and golfing.
*Morningstar Managers of the Year are determined by a combination of qualitative research by Morningstar’s manager research analysts; risk-adjusted medium- to long-term performance track records; and performance in the calendar year.


Matt Unger, CFA
Vice President, Portfolio Manager & Director of Research – Small Cap Growth
Matt Unger, CFA
Vice President, Portfolio Manager & Director of Research – Small Cap Growth
Matt Unger, a partner at Osterweis, is a Portfolio Manager for the small cap growth strategy. He enjoys identifying investments in small cap growth companies, particularly those in the Health Care and Industrials sectors.
Prior to joining Osterweis Capital Management in 2016, Matt was a Research Associate at RS Investments, covering small cap growth companies in the medical technology and industrial sectors. Before graduate school, he worked at Platte River Capital covering the medical device sector.
Matt graduated from Trinity University with a B.S. in Finance, cum laude and Southern Methodist University, Cox School of Business with an M.B.A. He holds the CFA designation. Outside of work, Matt enjoys golfing and traveling.


Bryan Wong, CFA
Co-CIO – Small Cap Growth & Portfolio Manager
Bryan Wong, a partner at Osterweis, is a Portfolio Manager for the small cap growth strategy. He is passionate about identifying overlooked opportunities with the potential to deliver strong, sustainable performance, helping clients achieve their long-term investment objectives. Bryan particularly enjoys investing in small companies, where the dynamic nature of the market provides fundamental investors the ability to gain a distinct edge through rigorous research and analysis.
Prior to joining Osterweis Capital Management in 2014, Bryan was a member of the investment team managing the endowment of the David and Lucile Packard Foundation. Before that, he was an Analyst at Wohl Capital Management, a long/short hedge fund.
Bryan graduated from Yale University with a B.A. in Political Science and International Studies with distinction and from the University of California Berkeley, Haas School of Business, with an M.B.A., where he was an Investment Management Fellow. He holds the CFA designation and is a member of the CFA Society of San Francisco. Bryan also serves on the investment committee of the Asian Pacific Fund. Outside of work, he enjoys spending time with family and swimming.
For more information about this strategy, please send us an email or call us at (800) 700-3316.
Related Insights
Opportunity Fund Quarter-End Performance (as of 6/30/26)
| Fund | 1 MO | QTD | YTD | 1 YR | 3 YR | 5 YR | 10 YR |
INCEP (10/1/2012) |
|---|---|---|---|---|---|---|---|---|
| OSTGX | 12.44% | 35.34% | 30.22% | 41.37% | 18.23% | 5.05% | 16.63% | 15.05% |
| Russell 2000 Growth Index | 3.55% | 25.71% | 22.18% | 38.74% | 18.44% | 5.57% | 11.97% | 11.67% |
Gross/Net expense ratio as of 3/31/26: 1.22% / 1.12%. The Adviser has contractually agreed to waive certain fees through June 30, 2027. The net expense ratio is applicable to investors.
Performance data quoted represent past performance; past performance does not guarantee future results. The investment return and principal value of an investment will fluctuate so that an investor’s shares, when redeemed, may be worth more or less than their original cost. Current performance of the Fund may be higher or lower than the performance quoted. Performance data current to the most recent month end may be obtained by calling shareholder services toll free at (866) 236-0050. Performance prior to December 1, 2016 is that of another investment vehicle (the “Predecessor Fund”) before the commencement of the Fund’s operations. The Predecessor Fund was converted into the Fund on November 30, 2016. The Predecessor Fund’s performance shown includes the deduction of the Predecessor Fund’s actual operating expenses. In addition, the Predecessor Fund’s performance shown has been recalculated using the management fee that applies to the Fund, which has the effect of reducing the Predecessor Fund’s performance. The Predecessor Fund was not a registered mutual fund and so was not subject to the same operating expenses or investment and tax restrictions as the Fund. If it had been, the Predecessor Fund’s performance may have been lower.
Rates of return for periods greater than one year are annualized.
Where applicable, charts illustrating the performance of a hypothetical $10,000 investment made at a Fund’s inception assume the reinvestment of dividends and capital gains, but do not reflect the effect of any applicable sales charge or redemption fees. Such charts do not imply any future performance.
The Russell 2000 Growth Index (Russell 2000G) is a market-capitalization-weighted index representing the small cap growth segment of U.S. equities. This index does not incur expenses and is not available for investment. This index includes reinvestment of dividends and/or interest.
References to specific companies, market sectors, or investment themes herein do not constitute recommendations to buy or sell any particular securities.
There can be no assurance that any specific security, strategy, or product referenced directly or indirectly in this commentary will be profitable in the future or suitable for your financial circumstances. Due to various factors, including changes to market conditions and/or applicable laws, this content may no longer reflect our current advice or opinion. You should not assume any discussion or information contained herein serves as the receipt of, or as a substitute for, personalized investment advice from Osterweis Capital Management.
Complete holdings of all Osterweis mutual funds (“Funds”) are generally available ten business days following quarter end. Holdings and sector allocations may change at any time due to ongoing portfolio management. Fund holdings as of the most recent quarter end are available here: Opportunity Fund
This commentary contains the current opinions of the authors as of the date above, which are subject to change at any time, are not guaranteed, and should not be considered investment advice. This commentary has been distributed for informational purposes only and is not a recommendation or offer of any particular security, strategy, or investment product. Information contained herein has been obtained from sources believed to be reliable but is not guaranteed.
As of 6/30/2025, the Osterweis Opportunity Fund did not own Insulet.
Mutual fund investing involves risk. Principal loss is possible. The Osterweis Opportunity Fund may invest in unseasoned companies, which involve additional risks such as abrupt or erratic price movements. The Fund may invest in small and mid-sized companies, which may involve greater volatility than large-sized companies. The Fund may invest in IPOs and unseasoned companies that are in the early stages of their development and may pose more risk compared to more established companies. Higher turnover rates may result in increased transaction costs, which could impact performance. From time to time, the Fund may have concentrated positions in one or more sectors subjecting the Fund to sector emphasis risk. The Fund may invest in foreign and emerging market securities, which involve greater volatility and political, economic and currency risks and differences in accounting methods. These risks may increase for emerging markets.
The Osterweis Funds are available by prospectus only. The Funds’ investment objectives, risks, charges, and expenses must be considered carefully before investing. The summary and statutory prospectuses contain this and other important information about the Funds. You may obtain a summary or statutory prospectus by calling toll free at (866) 236-0050, or by visiting www.osterweis.com/statpro. Please read the prospectus carefully before investing to ensure the Fund is appropriate for your goals and risk tolerance.
Rankings are independently calculated by eVestment.
The Osterweis Opportunity Fund has been assigned by Morningstar to the Small Growth Peer Group.
Morningstar Small Growth Peer Group: Small-growth portfolios focus on faster-growing companies whose shares are at the lower end of the market-capitalization range. These portfolios tend to favor companies in up-and-coming industries or young firms in their early growth stages. Because these businesses are fast-growing and often richly valued, their stocks tend to be volatile. Stocks in the bottom 10% of the capitalization of the U.S. equity market are defined as small cap. Growth is defined based on fast growth (high growth rates for earnings, sales, book value, and cash flow) and high valuations (high price ratios and low dividend yields).
Morningstar Small-blend Peer Group: Small-blend portfolios favor US firms at the smaller end of the market-capitalization range. Some aim to own an array of value and growth stocks, while others employ a discipline that leads to holdings with valuations and growth rates close to the small-cap averages. Stocks in the bottom 10% of the capitalization of the US equity market are defined as small cap. The blend style is assigned to portfolios where neither growth nor value characteristics predominate.
Morningstar Large-blend Peer Group: Large-blend portfolios are fairly representative of the overall US stock market in size, growth, rates, and price. Stocks in the top 70% of the capitalization of the US equity market are defined as large cap. The blend style is assigned to portfolios where neither growth nor value characteristics predominate. These portfolios tend to invest across the spectrum of US industries, and owing to their broad exposure, the portfolios’ returns are often similar to those of the S&P 500 index.
Morningstar Large Growth Peer Group: Large-growth portfolios invest primarily in big US companies that are projected to grow faster than other large-cap stocks. Stocks in the top 70% of the capitalization of the US equity market are defined as large cap. Growth is defined based on fast growth (high growth rates for earnings, sales, book value, and cash flow) and high valuations (high price ratios and low dividend yields). Most of these portfolios focus on companies in rapidly expanding industries.
Floating Stacked Bar Graph: A floating stacked bar graph compares individual products or benchmarks to a group of peers. The markers on the graph represent the product(s) and/or benchmark(s). The stacked bar itself represents 90% of the peer group broken down into quartiles. The area above and below the bar represents the top 5% and bottom 5% of the peer group.
eVestment Alliance, LLC and its affiliated entities (collectively, “eVestment”) collect information directly from investment management firms and other sources believed to be reliable; however, eVestment does not guarantee or warrant the accuracy, timeliness, or completeness of the information provided and is not responsible for any errors or omissions. Performance results may be provided with additional disclosures available on eVestment’s systems and other important considerations such as fees that may be applicable. Not for general distribution and limited distribution may only be made pursuant to client’s agreement terms. * All categories not necessarily included, Totals may not equal 100%. Copyright 2012-2025 eVestment Alliance, LLC. All Rights Reserved.
Jensen’s Alpha is a measure of the difference between the portfolio’s actual return versus its expected performance, given its level of risk as measured by Beta. It is a measure of the historical movement of a portfolio’s performance not explained by movements of the market. It is also referred to as a portfolio’s non-systematic return.
Active investing has higher management fees because of the manager’s increased level of involvement while passive investing has lower management and operating fees. Investing in both actively and passively managed mutual funds involves risk and principal loss is possible. Both actively and passively managed mutual funds generally have daily liquidity. There are no guarantees regarding the performance of actively and passively managed mutual funds. Actively managed mutual funds may have higher portfolio turnover than passively managed funds. Excessive turnover can limit returns and can incur capital gains.
The return on assets (ROA) ratio shows how efficiently a company uses its assets to generate profits. It is calculated by dividing a company’s net income by its total assets.
Price-to-Earnings (P/E) Ratio is the ratio of a company’s stock price to its 12 months’ earnings per share.
Osterweis Capital Management is the adviser to the Osterweis Funds, which are distributed by Quasar Distributors, LLC. [OCMI-808682-2025-09-24]
