Please see below for a discussion of the Osterweis Opportunity Fund’s recent performance and our near-to-medium term market outlook.
Performance (as of June 30, 2026)
| QTR | 1 Year | 3 Year | 5 Year | 10 Year | Since Inception (10/1/2012) | |
|---|---|---|---|---|---|---|
| OSTGX | 35.34 | 41.37 | 18.23 | 5.05 | 16.63 | 15.05 |
| Russell 2000 Growth Index | 25.71 | 38.74 | 18.44 | 5.57 | 11.97 | 11.67 |
All figures in this table reflect percentages. Periods longer than one year are annualized.
Performance data quoted represent past performance; past performance does not guarantee future results. The investment return and principal value of an investment will fluctuate so that an investor’s shares, when redeemed, may be worth more or less than their original cost. Current performance of the Fund may be higher or lower than the performance quoted. Performance data current to the most recent month end may be obtained by calling (866) 236-0050.Gross/Net expense ratio as of March 31, 2026: 1.22% / 1.12%. The Adviser has contractually agreed to waive certain fees through June 30, 2027. The net expense ratio is applicable to investors. See additional disclosures at the end of the letter.
Market Recap
The second quarter was a bullish stretch in the markets and a stark turnaround from the lackluster first quarter. The Russell 2000 Growth Index gained 25.7% and the S&P 500 rose 15.2%, the best quarterly returns for both benchmarks since 2020. The Opportunity Fund fared even better, returning 35.3%.
Robust corporate profits were the primary driver of the rally, but there were other factors, too. Most importantly, AI infrastructure and semiconductor companies continued to push the market higher on increased investment from the Magnificent 7. Also, during the second quarter, concerns about the inflationary effects of the oil shock from the Iran war began to fade, as hostilities cooled and markets adapted to increased oil price volatility. In addition, both the labor market and consumer spending were healthy during the second quarter.
Portfolio Attribution
Security Selection
Security selection was by far the biggest driver of our outperformance this quarter. Our holdings in Information Technology, Industrials, Health Care, and Consumer Discretionary — our four largest sectors by weight — each substantially outperformed their counterparts in the index. On the other hand, our holdings in our three smallest sectors, Consumer Staples, Financials, and Real Estate, each lagged their counterparts, but their collective impact on relative results was not significant (and all but one generated absolute gains).
Our Information Technology holdings once again added the most to our relative performance, largely driven by the explosive growth in AI. The IT sector of the Russell 2000 Growth Index returned an impressive 47% during the quarter, but we still outperformed, returning 61%. AI adoption rates continue to accelerate, and last year Anthropic achieved what is likely the fastest revenue growth in enterprise software history, with its annual recurring revenue soaring from $9 billion in December 2025 to more than $47 billion in May of 2026. Likewise, Google reached over 3.2 quadrillion monthly tokens processed, a more than 7x increase in one year. The explosion in AI inference is driving a massive increase in CapEx, benefiting many of the small cap semiconductor and infrastructure companies in our portfolio.
Our best performer within IT was SiTime, which returned 114% in the quarter. The company is the leading pure-play precision timing semiconductor company, with increasing adoption in AI data centers and other applications like Apple’s iPhone. The company reported 88% growth in its most recent quarter, reflecting broad-based acceleration in its Communications, Enterprise, and Data Center division. SiTime also acquired Renesas's timing business, furthering its target of 25-30% annual growth and 30%+ operating margins. We believe precision timing is an underappreciated part of AI infrastructure, and SiTime is the market leader.
Another strong performer in IT was Semtech, a leading provider of high-performance analog and mixed-signal semiconductors, whose connectivity solutions are increasingly critical to AI data centers. The company reported strong growth in both its data center and LoRa businesses, which is the company’s long-range, ultra-low-power wireless platform designed for the Internet of Things. Management guided to 85% growth next quarter and may also divest its non-core Sierra Wireless business, which would boost gross margins. We believe Semtech is well positioned as a critical supplier in the transition to higher-bandwidth AI interconnect infrastructure.
One of our few IT underperformers was Fabrinet, a leading provider of advanced optical packaging and precision manufacturing services to complex technology companies, serving customers across optical communications, networking, and industrial end markets. While Fabrinet reported strong overall growth approaching 40%, ongoing commodity related supply constraints are limiting shipment volumes. We trimmed the position, favoring companies that are demonstrating strong execution in the current environment.
Our Industrials holdings also outperformed their counterparts in the index, and the biggest contributor was Cardinal Infrastructure. The company reported strong first quarter results, including 64% organic growth, announced their first data center win, and executed a well-priced secondary late in the quarter, generating excitement that more accretive M&A is on the way. The company is still led by its founder and operates in just two states today. We believe there is a meaningful long-term opportunity for Cardinal’s superior vertically integrated service model to grow organically and inorganically for many years to come.
On the downside, FirstService, a provider of residential and commercial property services, had a tough Q2 as both its roofing and residential closet businesses remained soft. This has weighed on organic growth for several quarters, but we expect it to pick up in the second half of the year, driven by not only easier comps but a normalization in its storm restoration business (2025 had limited weather activity). Despite the company's soft Q2 results, we are maintaining our position, as revenues should accelerate and its valuation is at the low end of its ten-year history. We also believe it will be a favorable area to allocate capital if the AI trade begins to cool a little.
Our Health Care investments also had a strong quarter on both a relative and absolute basis. One of our best performers was Hinge Health, a provider of virtual physical therapy that benefitted from exceptional financial results and a realization by investors that this was not a software company prone to AI disruption. Q2 billings increased 52% year-over-year, driven by a combination of new members as well as higher utilization. Furthermore, the company raised Q2 guidance intra-quarter during its analyst day in June. While we are excited by current trends, we do not think Hinge’s growth rates are sustainable, so we have been trimming our position.
Our Consumer Discretionary names also outperformed in the second quarter, led by Life Time Group, which operates high-end health clubs nationwide. The company has been a strong performer for the year and a half that we have owned it, consistently beating and raising estimates, however we believe the private equity overhang was holding back the stock. When the company reported its first quarter earnings, it announced that it had reached an agreement with Atairos to purchase shares from PE holders Leonard Green and TPG. The stock responded positively to this news, and then the PE holders sold another block the next day, cutting their combined position to under 10%. We believe that the fears of this secondary overhang are behind us, and investors will now shift their focus to the long-term opportunity of 400-500 gyms nationwide, up from 190 today.
Sector Allocation
Sector allocation was also additive to our relative performance this quarter. Our overweight to Information Technology was particularly helpful, as was the absence of Energy and Materials exposure. While our underweight to Financials and Industrials as well as our overweight to Health Care detracted from our relative returns, the impact was not significant.
Portfolio Positioning & Outlook
Looking ahead, we continue to believe that AI will remain a key driver of both economic growth and market performance. However, many AI-related stocks have delivered exceptional returns, and we may see a period of consolidation as customers rationalize spending and the growth rate of infrastructure investments moderates from current levels.
As a result, we have taken profits in a number of Technology and Industrials holdings and are increasingly focused on areas that may have been overlooked by the market, including both underappreciated future beneficiaries of AI and companies whose prospects are not directly tied to AI. These opportunities include select Software, Health Care, and Consumer companies that offer attractive fundamentals, compelling valuations, and favorable long-term growth prospects.
We thank you for your continued confidence in our management.
James Callinan, CFA
Co-CIO – Small Cap Growth & Portfolio Manager
Bryan Wong, CFA
Co-CIO – Small Cap Growth & Portfolio Manager
Featuring
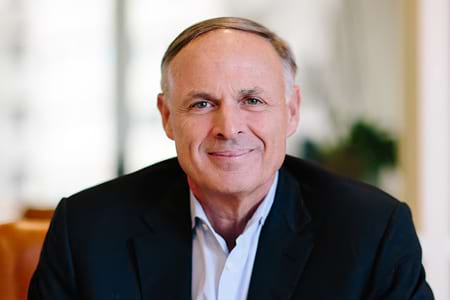

James Callinan, CFA
Co-CIO – Small Cap Growth & Portfolio Manager
Jim Callinan, a partner at Osterweis, is a Portfolio Manager for the small cap growth strategy. Throughout his career he has focused on investing in companies that are early in their growth cycles. This experience has been the foundation of our high conviction, valuation-aware approach to investing in small cap growth companies.
Prior to Osterweis, Jim was the Co-Founder & Chief Investment Officer at RS Investments. He also founded the RS Growth Group LLC in 1996 and managed the RS Emerging Growth Fund from 1996 until 2010. In 1999 Jim was named Morningstar’s Domestic Stock Manager of the Year.*
Jim served as portfolio manager for the Putnam OTC Emerging Growth Fund from 1994 to 1996 and began his career at Putnam Investments as an equity research analyst in 1987. He joined Osterweis in 2016 and brought with him the Emerging Growth Partners, LP, a concentrated small cap growth strategy he founded at RS in 2006.
Jim graduated from Harvard College with a B.A. in Economics, New York University with an M.S. in Accounting, and Harvard Business School with an M.B.A. He holds the CFA designation and is a member of the Weatherbie Capital Advisory Board. Outside of work, Jim enjoys spending time with his family, travelling, and golfing.
*Morningstar Managers of the Year are determined by a combination of qualitative research by Morningstar’s manager research analysts; risk-adjusted medium- to long-term performance track records; and performance in the calendar year.
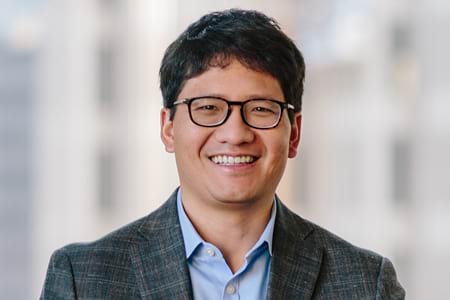
Bryan Wong, CFA
Co-CIO – Small Cap Growth & Portfolio Manager
Bryan Wong, a partner at Osterweis, is a Portfolio Manager for the small cap growth strategy. He is passionate about identifying overlooked opportunities with the potential to deliver strong, sustainable performance, helping clients achieve their long-term investment objectives. Bryan particularly enjoys investing in small companies, where the dynamic nature of the market provides fundamental investors the ability to gain a distinct edge through rigorous research and analysis.
Prior to joining Osterweis Capital Management in 2014, Bryan was a member of the investment team managing the endowment of the David and Lucile Packard Foundation. Before that, he was an Analyst at Wohl Capital Management, a long/short hedge fund.
Bryan graduated from Yale University with a B.A. in Political Science and International Studies with distinction and from the University of California Berkeley, Haas School of Business, with an M.B.A., where he was an Investment Management Fellow. He holds the CFA designation and is a member of the CFA Society of San Francisco. Bryan also serves on the investment committee of the Asian Pacific Fund. Outside of work, he enjoys spending time with family and swimming.
For more information about this strategy, please send us an email or call us at (800) 700-3316.
Related Insights
This commentary contains the current opinions of the authors as of the date above, which are subject to change at any time, are not guaranteed, and should not be considered investment advice. This commentary has been distributed for informational purposes only and is not a recommendation or offer of any particular security, strategy, or investment product. Information contained herein has been obtained from sources believed to be reliable but is not guaranteed.
Performance prior to December 1, 2016 is that of another investment vehicle (the “Predecessor Fund”) before the commencement of the Fund’s operations. The Predecessor Fund was converted into the Fund on November 30, 2016. The Predecessor Fund’s performance shown includes the deduction of the Predecessor Fund’s actual operating expenses. In addition, the Predecessor Fund’s performance shown has been recalculated using the management fee that applies to the Fund, which has the effect of reducing the Predecessor Fund’s performance. The Predecessor Fund was not a registered mutual fund and so was not subject to the same operating expenses or investment and tax restrictions as the Fund. If it had been, the Predecessor Fund’s performance may have been lower.
The Osterweis Funds are available by prospectus only. The Funds’ investment objectives, risks, charges, and expenses must be considered carefully before investing. The summary and statutory prospectuses contain this and other important information about the Funds. You may obtain a summary or statutory prospectus by calling toll free at (866) 236-0050, or by visiting www.osterweis.com/statpro. Please read the prospectus carefully before investing to ensure the Fund is appropriate for your goals and risk tolerance.
Mutual fund investing involves risk. Principal loss is possible. The Osterweis Opportunity Fund may invest in unseasoned companies, which involve additional risks such as abrupt or erratic price movements. The Fund may invest in small and mid-sized companies, which may involve greater volatility than large-sized companies. The Fund may invest in IPOs and unseasoned companies that are in the early stages of their development and may pose more risk compared to more established companies. Higher turnover rates may result in increased transaction costs, which could impact performance. From time to time, the Fund may have concentrated positions in one or more sectors subjecting the Fund to sector emphasis risk. The Fund may invest in foreign and emerging market securities, which involve greater volatility and political, economic and currency risks and differences in accounting methods. These risks may increase for emerging markets.
The Russell 2000 Growth Index (Russell 2000G) is a market-capitalization-weighted index representing the small cap growth segment of U.S. equities. This index does not incur expenses and is not available for investment. This index includes reinvestment of dividends and/or interest.
The S&P 500 Index is widely regarded as the standard for measuring large cap U.S. stock market performance. The index does not incur expenses, is not available for investment, and includes the reinvestment of dividends.
Capital expenditures (CapEx) are funds used by a company to acquire, upgrade, and maintain physical assets such as property, plants, buildings, technology, or equipment.
The Magnificent 7 stocks are Alphabet, Amazon, Apple, Meta Platforms, Microsoft, NVIDIA, and Tesla.
References to specific companies, market sectors, or investment themes herein do not constitute recommendations to buy or sell any particular securities.
There can be no assurance that any specific security, strategy, or product referenced directly or indirectly in this commentary will be profitable in the future or suitable for your financial circumstances. Due to various factors, including changes to market conditions and/or applicable laws, this content may no longer reflect our current advice or opinion. You should not assume any discussion or information contained herein serves as the receipt of, or as a substitute for, personalized investment advice from Osterweis Capital Management.
Complete holdings of all Osterweis mutual funds (“Funds”) are generally available ten business days following quarter end. Holdings and sector allocations may change at any time due to ongoing portfolio management. Fund holdings as of the most recent quarter end are available here: Opportunity Fund Complete Holdings (as of 9/30/2026).
Osterweis Capital Management is the adviser to the Osterweis Funds, which are distributed by Quasar Distributors, LLC. [OCMI-973051-2026-07-22]