Looking back at the financial headlines of 2025, you would be excused if you thought the health of the economy was broad and deep: the S&P 500 Index saw a total return of 17.9%, U.S. real GDP accelerated to 4.3% annual growth in the third quarter of the year, and unemployment stayed relatively tame at 4.4% as of December 2025.
However, 2025 also saw the highest rate of U.S. corporate bankruptcies in 15 years, eclipsed only by the post-Great Financial Crisis highs last seen in 2010. So-called “mega bankruptcies,” or bankruptcy filings by companies with over $1 billion in assets, also surged. And the S&P 500 Equal Weight Index saw a healthy, but much lower, total return of 11.4% vs. its market cap weighted equivalent (the standard S&P 500).
In this quarter’s outlook, we examine why the economy looks so healthy on the one hand and more precarious on the other, and we elaborate on how we are positioning client portfolios to navigate this evident divergence.
A Brief Review of Recent Market History
While it is natural to look back at the last three years — which have been dominated by the AI narrative ever since ChatGPT’s public release on November 30, 2022 — and marvel at how strong market returns have been since then, there has in fact been substantial volatility and uncertainty under the hood.
Recall that the spring of 2023 saw a rash of regional bank failures driven by rapid interest rate hikes by the Federal Reserve, leading to concerns of a broader banking crisis that never materialized, given large banks’ well-capitalized balance sheets. Then 2024 saw persistent uncertainty leading up to the presidential election, punctuated by an unexpected interest rate increase by the Bank of Japan that forced a rapid unwind of the Yen carry trade and drove a sharp tech selloff before a strong recovery in the fourth quarter. And 2025 started with massive public sector layoffs, a litany of regulatory and other government changes, and the unleashing of an unprecedented tariff regime that has since been largely walked back, in addition to the so-called “DeepSeek moment” that called into question the wisdom of rampant AI spending.
The net result has been a three-year bull market, albeit one driven by narrow sectors of the economy. In fact, the S&P 500 Index has generated an eye-popping 23% annualized return over the last three years, while the S&P 500 Equal Weight Index has generated a more prosaic, but still impressive, 12.8% annualized return. To frame it another way, the market multiples of the S&P 500 Index and its sister Equal Weight Index were tightly bound for the decade leading up to 2022 but have widely diverged since then.
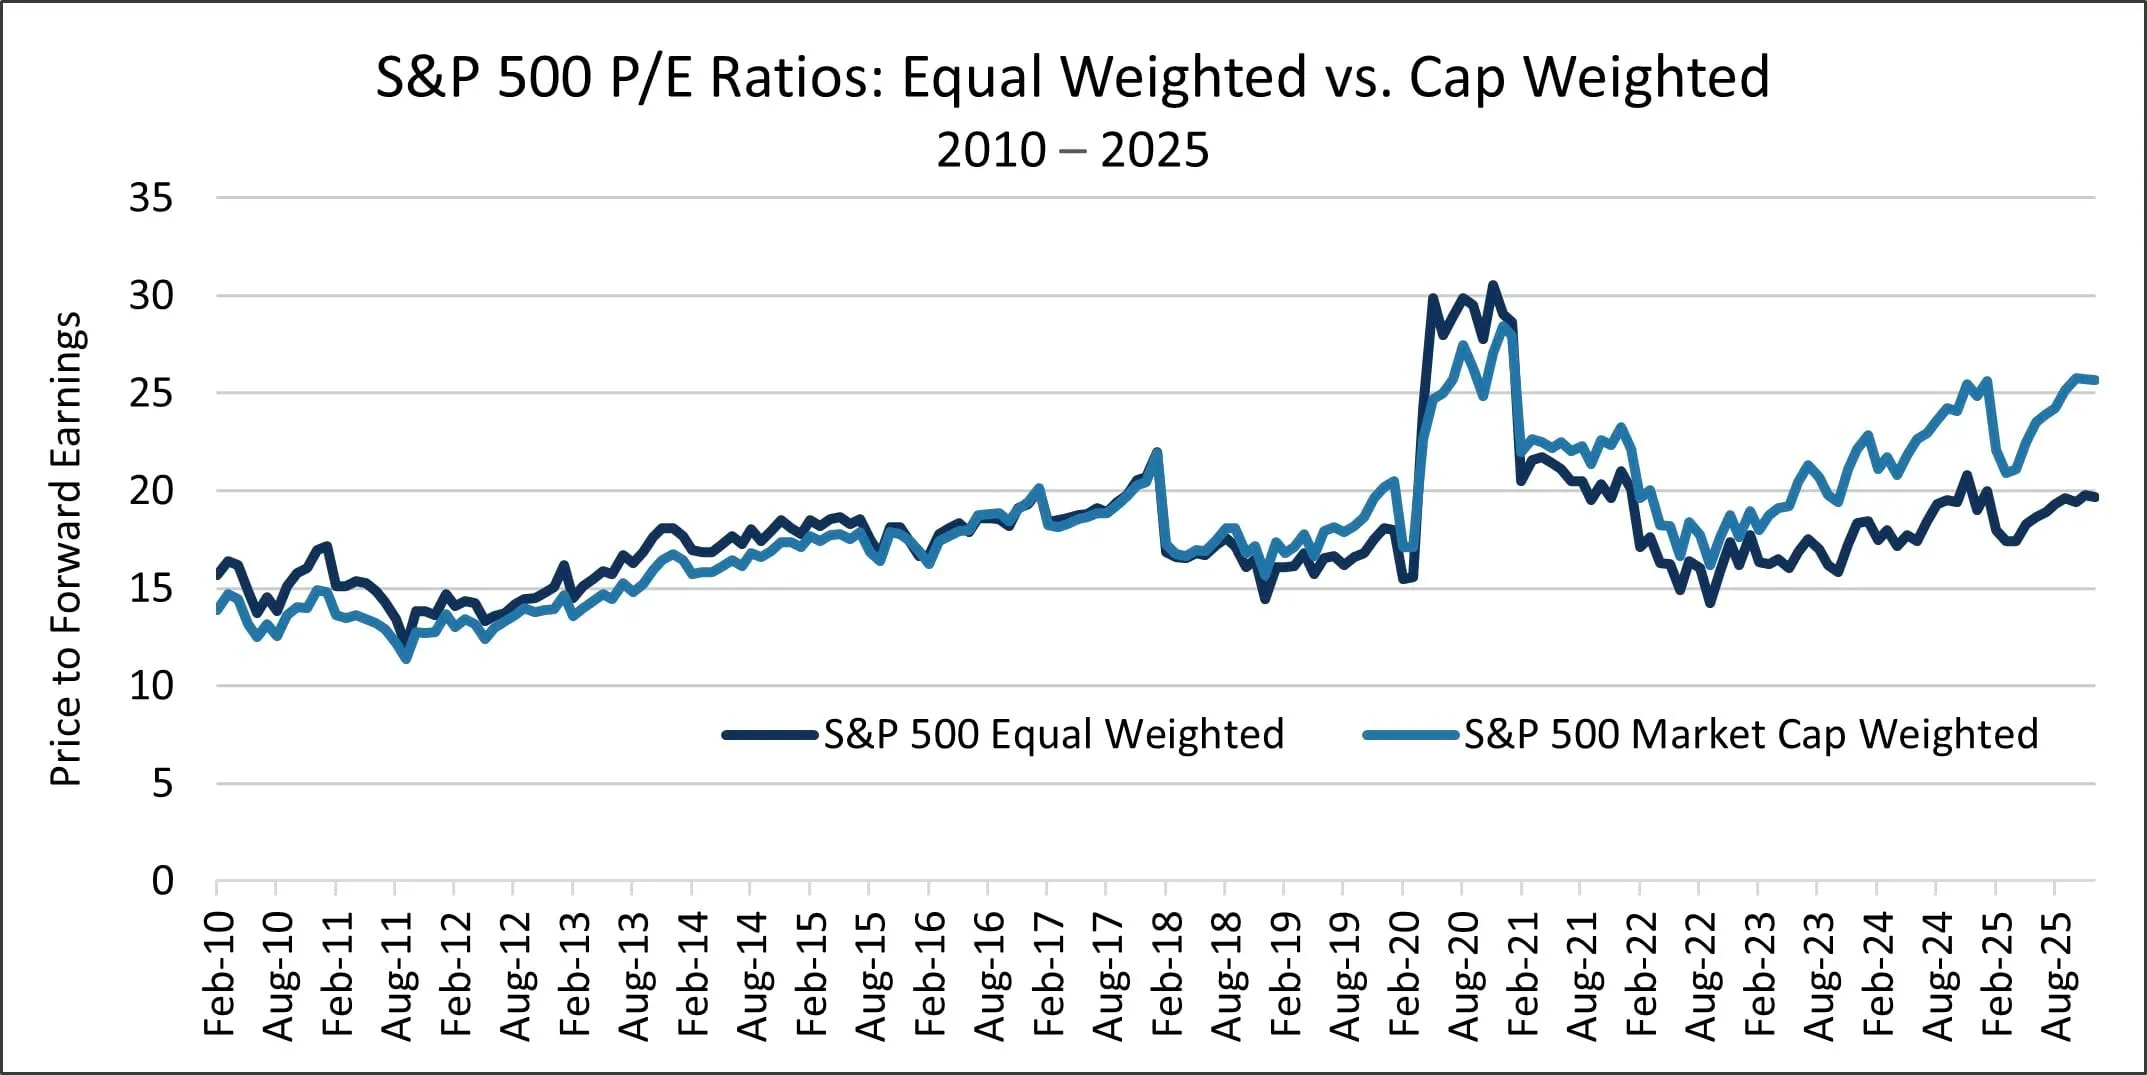
We think this divergence in returns and market multiples speaks to the underlying issues facing the economy: all things AI are growing rapidly, while tariffs have clobbered certain sectors of the U.S. economy by elongating the inflation cycle, and higher interest rates are biting companies and consumers that previously relied on cheap debt.
The AI Haves
According to The Wall Street Journal, as much as half of real GDP growth in the first six months of 2025 was driven by business investment in AI. The divergence between the AI economy and the rest of the economy is well captured by a BofA analysis that estimates private nonresidential fixed investment (i.e., investments in physical assets, including plants, machinery, construction, etc.) has roughly tripled for data centers since the end of 2022, while all other nonresidential fixed investment has been roughly flat over that same timeframe.
While the AI investment boom deserves careful scrutiny given the scale of investment by a handful of companies — Goldman Sachs estimates hyperscalers invested nearly $400 billion in CapEx in 2025, equivalent to roughly 1% of U.S. GDP — our research indicates that large companies are seeing tangible returns from implementing AI for everything from better targeting of online advertising, to coding efficiencies, to improved customer service, to predictive manufacturing, to better routing and logistics. As a result, we believe the AI boom is sustainable and the investment appears to be justified thus far. However, we are ever vigilant in monitoring companies’ investment plans and the returns (or lack thereof) on AI spend.
Maybe most importantly, the so-called Magnificent 7 companies, many of which are deeply involved in AI spend, generated roughly 27% EPS growth in 2025, according to Bloomberg, reflecting significant financial benefits from the AI investment cycle.
The Non-AI Have Nots
As it relates to inflation and tariffs, the industrial and consumer discretionary sectors appear to have been hurt the most. In fact, these two sectors by far account for the largest number of U.S. corporate bankruptcies. We attribute this concentration to the fact that many industrial and consumer discretionary businesses import products from abroad. Already facing persistent inflation from the post-Covid supply chain crisis, the rise in average tariffs from roughly 2% entering 2025 to roughly 11% as of September 2025 has meant that companies reliant on imports have faced massive further cost increases for certain inputs. If a company lacks pricing power and/or is not nimble enough to shift production, the heavier burden can crush already strained profitability almost overnight. Add in the fact that interest rates moved significantly higher over the course of 2022 and have largely stayed elevated despite recent rate cuts, and companies with strained balance sheets cannot survive, or are forced to just limp along.
Unfortunately, many average consumers must deal with these same pressures. While incomes have increased in recent years, inflation has persisted, made only worse by the tariff regime, saddling consumers with ever higher prices on everything from apparel, to automobiles, to food. Add in rising interest rates on credit card debt, auto loans, and home mortgages, and consumers are also facing a litany of headwinds.
Reflecting these realities, the ISM Manufacturing PMI has been below 50, indicating a contracting U.S. manufacturing base, for ten straight months since March 2025. In fact, the U.S. manufacturing base has been in contraction since November 2022, with the exception of just two months in early 2025, before the tariff regime came into effect. Furthermore, consumer confidence is hovering at 45-year lows.
We would note at least three mitigating factors. First, the Federal Reserve began cutting rates in 2025, easing the interest cost burden on both companies and consumers. Second, both business and consumer leverage are at healthy levels, dramatically reducing the risk of a debt-fueled crisis in our view. Third, high-income spenders are making up for softness among low-income consumers, as the top 10% of earners now account for roughly half of all consumer spending.
Consistent with the narrative above, the S&P 500 Index, excluding the Magnificent 7, grew EPS at roughly 12% in 2025 according to Bloomberg. While growing at less than half the rate of the Magnificent 7, the non-AI economy is still expanding, and we believe the largest companies in the economy (those in the S&P 500) are much better positioned than most others given competitive advantages they enjoy like economies of scale. In fact, The Wall Street Journal recently ran a story detailing how “over the past six months, private firms with fewer than 50 workers have steadily shed jobs…cutting 120,000 [jobs] in November alone.” Meanwhile, midsize and especially large firms have in fact added jobs over the same timeframe. The article explains this widening gap by pointing out that “small-business profits are faltering” while larger businesses are better equipped to deal with the current economic headwinds and grow.
How We Are Positioning Portfolios
As noted above, we view the economy as increasingly divided between AI and non-AI companies. We believe there are merits to investing in businesses in both camps, especially when considering valuation discrepancies between the two. We continue to invest in companies exposed to AI, although our investments in this area are in businesses that we believe will continue to thrive even if there are bumps in the road in the AI investment cycle. At the same time, we continue to invest aggressively in non-AI players operating in other sectors like Financials, Industrials, Consumer, and Health Care but with a strong preference for sectors benefitting from secular tailwinds. This helps ensure persistent growth in most environments.
Regardless, we believe every position held in client portfolios fits our quality growth framework, underpinned by strong competitive advantages reflected in growing free cash flow, a reinvestment opportunity to drive future growth, and strong governance. When purchased at reasonable valuations, we believe these companies will generate attractive investment returns, regardless of what theme is driving markets at any one moment.
Concluding Thoughts
While headlines reflect a strong and growing economy, there are many crosscurrents that must be examined. AI investment is booming, and for good reason in our view, but is not without risk. Meanwhile, the non-AI economy in general is exhibiting slower growth with a broad range of outcomes: from small, poorly managed and undercapitalized businesses facing many headwinds to well-run, excellent companies posting solid growth. We believe that owning a select basket of well-researched quality growth businesses at attractive valuations spanning the AI and non-AI economy should reward patient, long-term oriented investors.
We thank you for your continued confidence in our management, and we wish you a prosperous and happy new year.
John Osterweis
Founder, Chairman & Co-Chief Investment Officer – Core Equity
Gregory Hermanski
Co-Chief Investment Officer – Core Equity
Nael Fakhry
Co-Chief Investment Officer – Core Equity
Featuring
John Osterweis
Founder, Chairman & Co-Chief Investment Officer – Core Equity
John Osterweis founded Osterweis Capital Management to serve the portfolio needs of high-net-worth investors, foundations, and endowments. He is currently Chairman of the firm as well as a member of the firm’s Management Committee and a Portfolio Manager for the core equity, growth & income, and flexible balanced strategies.
After graduating from business school, John served as a Senior Analyst concentrating on the forest products and paper industry for several regional brokerage firms and later for E.F. Hutton & Company, Inc. In addition to his activities as an analyst, John served as Director of Research for two firms and managed equity portfolios for over ten years. In late 1982, John decided to devote himself full time to his portfolio management activities, and in April of 1983 launched Osterweis Capital Management.
John graduated from Bowdoin College (B.A. in Philosophy, cum laude), and Stanford Graduate School of Business (M.B.A. with top honors in Finance).
Outside of his work, John is an active supporter of our community. He has served as Director of the Lucas Museum of Narrative Art, Director on the Stanford Alumni Association Executive Board, Trustee of Bowdoin College, Director and Vice Chairman of Mt. Zion Hospital and Medical Center, and President of the Board of Directors for Summer Search Foundation. He currently serves as a Trustee of the San Francisco Ballet Association, Director of the San Francisco Free Clinic, and President Emeritus of the San Francisco Ballet Endowment Foundation, as well as Trustee Emeritus of Summer Search Foundation and of Bowdoin College. He also enjoys horseback riding and other outdoor activities.

Gregory Hermanski
Co-Chief Investment Officer – Core Equity
Greg Hermanski, a partner at Osterweis, is a Portfolio Manager for the core equity, growth & income, quality cyclical growth, and flexible balanced strategies. He enjoys working with his team to protect and grow our clients’ wealth. Greg feels that humility and discipline are key to succeeding in this industry and loves the continuous chance to learn as part of his role.
Prior to joining Osterweis in 2002, Greg was a Vice President at Robertson Stephens and Co. where he was in charge of convertible bond research. Prior to that, Greg was a Research Analyst covering convertible, high yield, and distressed securities at Imperial Capital, LLC, and a Valuation Consultant for Price Waterhouse, LLC.
Greg graduated from the University of California, Los Angeles with a B.A. in Business/Economics. Outside of work, he enjoys traveling, mountain biking, running, reading, and learning about history.

Nael Fakhry
Co-Chief Investment Officer – Core Equity
Nael Fakhry, a partner at Osterweis, is a Portfolio Manager for the core equity, growth & income, quality cyclical growth, and flexible balanced strategies. He loves the process of researching companies and studying the history of various industries.
Prior to joining Osterweis Capital Management in 2011, Nael worked as an Associate at American Securities, a private equity firm, and as an Analyst in the investment banking division of Morgan Stanley.
Nael graduated from Stanford University with a B.A. in History, Phi Beta Kappa and the University of California Berkeley, Walter A. Haas School of Business with an M.B.A., where he was a C.J. White Scholar. Outside of his professional life, Nael enjoys coaching his kids’ soccer and basketball teams, reading, and running. He also contributes to the community as Treasurer and member of the Board of Directors of the Burlingame Community Education Foundation, where he supports local education and helps manage the endowment.
For more information about this strategy, please send us an email or call us at (800) 700-3316.
Related Insights
The Osterweis Funds are available by prospectus only. The Funds’ investment objectives, risks, charges, and expenses must be considered carefully before investing. The summary and statutory prospectuses contain this and other important information about the Funds. You may obtain a summary or statutory prospectus by calling toll free at (866) 236-0050, or by visiting www.osterweis.com/statpro. Please read the prospectus carefully before investing to ensure the Fund is appropriate for your goals and risk tolerance.
Mutual fund investing involves risk. Principal loss is possible.
The Osterweis Fund may invest in medium and smaller sized companies, which involve additional risks such as limited liquidity and greater volatility. The Fund may invest in foreign and emerging market securities, which involve greater volatility and political, economic and currency risks and differences in accounting methods. These risks may increase for emerging markets. The Fund may invest in debt securities that are un-rated or rated below investment grade. Lower-rated securities may present an increased possibility of default, price volatility or illiquidity compared to higher-rated securities. Investments in debt securities typically decrease in value when interest rates rise.
Investment and insurance products are not FDIC or any other government agency insured, are not bank guaranteed, and may lose value.
No part of this article may be reproduced in any form, or referred to in any other publication, without the express written permission of Osterweis Capital Management.
This commentary contains the current opinions of the authors as of the date above, which are subject to change at any time, are not guaranteed, and should not be considered investment advice. This commentary has been distributed for informational purposes only and is not a recommendation or offer of any particular security, strategy, or investment product. Information contained herein has been obtained from sources believed to be reliable but is not guaranteed.
References to specific companies, market sectors, or investment themes herein do not constitute recommendations to buy or sell any particular securities.
Price-to-Earnings (P/E) Ratio is the ratio of a company’s stock price to its 12 months’ earnings per share.
Free cash flow represents the cash that a company is able to generate after laying out the money required to maintain and expand the company’s asset base. Free cash flow is important because it allows a company to pursue opportunities that enhance shareholder value.
The Magnificent 7 stocks are Alphabet, Amazon, Apple, Meta Platforms, Microsoft, NVIDIA, and Tesla.
Duration measures the sensitivity of a fixed income security’s price to changes in interest rates. Fixed income securities with longer durations generally have more volatile prices than those of comparable quality with shorter durations.
Gross Domestic Product (GDP) is the monetary value of all the finished goods and services produced within a country’s borders in a specific time period.
The S&P 500 Index is widely regarded as the standard for measuring large cap U.S. stock market performance. The index does not incur expenses, is not available for investment, and includes the reinvestment of dividends.
The S&P 500 Equal Weight Index is composed of the stocks held in the S&P 500 Index using an equal-weighted approach instead of market cap-weighted.
Earnings per share (EPS) is the company’s profit per outstanding share of common stock.
Capital expenditures (CapEx) are funds used by a company to acquire, upgrade, and maintain physical assets such as property, plants, buildings, technology, or equipment.
Investment grade bonds are those with high and medium credit quality as determined by ratings agencies.
Purchasing Managers Index (PMI) is an indicator of the economic health of the manufacturing sector. The PMI index is based on five major indicators: new orders, inventory levels, production, supplier deliveries and the employment environment.
Osterweis Capital Management is the adviser to the Osterweis Funds, which are distributed by Quasar Distributors, LLC. [OCMI-868252-2026-01-16]
