For years now, we have written about the rising dominance of large-scale tech companies across the economy. The inherent network effects, switching costs, and economies of scale across software and internet businesses have meant that just a few companies tend to dominate these sectors. Semiconductor businesses even joined the party, as a small clique of highly differentiated hardware businesses has gained tremendous scale. Importantly, regulators have allowed these technology businesses to maintain and grow their scale. As these businesses have grown, they have generated enormous amounts of cash flow, which they have used to invest further in their core businesses — cementing their dominance — while also expanding into adjacent areas, ever increasing their addressable markets. This virtuous cycle of higher cash flow and continual reinvestment has created juggernauts with almost impregnable business moats and pristine balance sheets overflowing with cash, so much so that many began paying dividends and repurchasing gobs of their own shares.
That is, until AI came around. Looking forward, the picture appears to have dramatically changed in critical ways.
A Change of The Guard and a Radical Shift in Capital Allocation
The first major change, as we wrote about in last quarter’s outlook, is that many software companies in particular face unique threats as a result of AI. These threats have in part led to a recent slowing of growth across much of the software sector and an attempt to reinvest profits to bolster against the AI threat and reignite future growth. The days of seemingly endless revenue increases and expanding margins for the entire software sector, even commodity areas of software, appear to be in the rearview mirror. Increasingly, a narrow set of incumbent software companies — namely, a small handful of key infrastructure software players and security software companies — and a burgeoning set of AI-native software businesses look set to dominate the future. The disintermediation of software traces back to the frontier AI labs, such as OpenAI and Anthropic. These businesses sell "tokens" — the unit of compute a model consumes each time it answers a question or writes code. Appetite for tokens is insatiable. To put the pace of growth in perspective, Anthropic roughly tripled its revenue run-rate in a matter of months, adding more new revenue in that short window than dozens of established public software companies generated in an entire year combined. Growth that fast is almost unheard of and is why AI labs keep signing long-term deals to lock up computing capacity years out — which flows straight to the hyperscalers that host them.
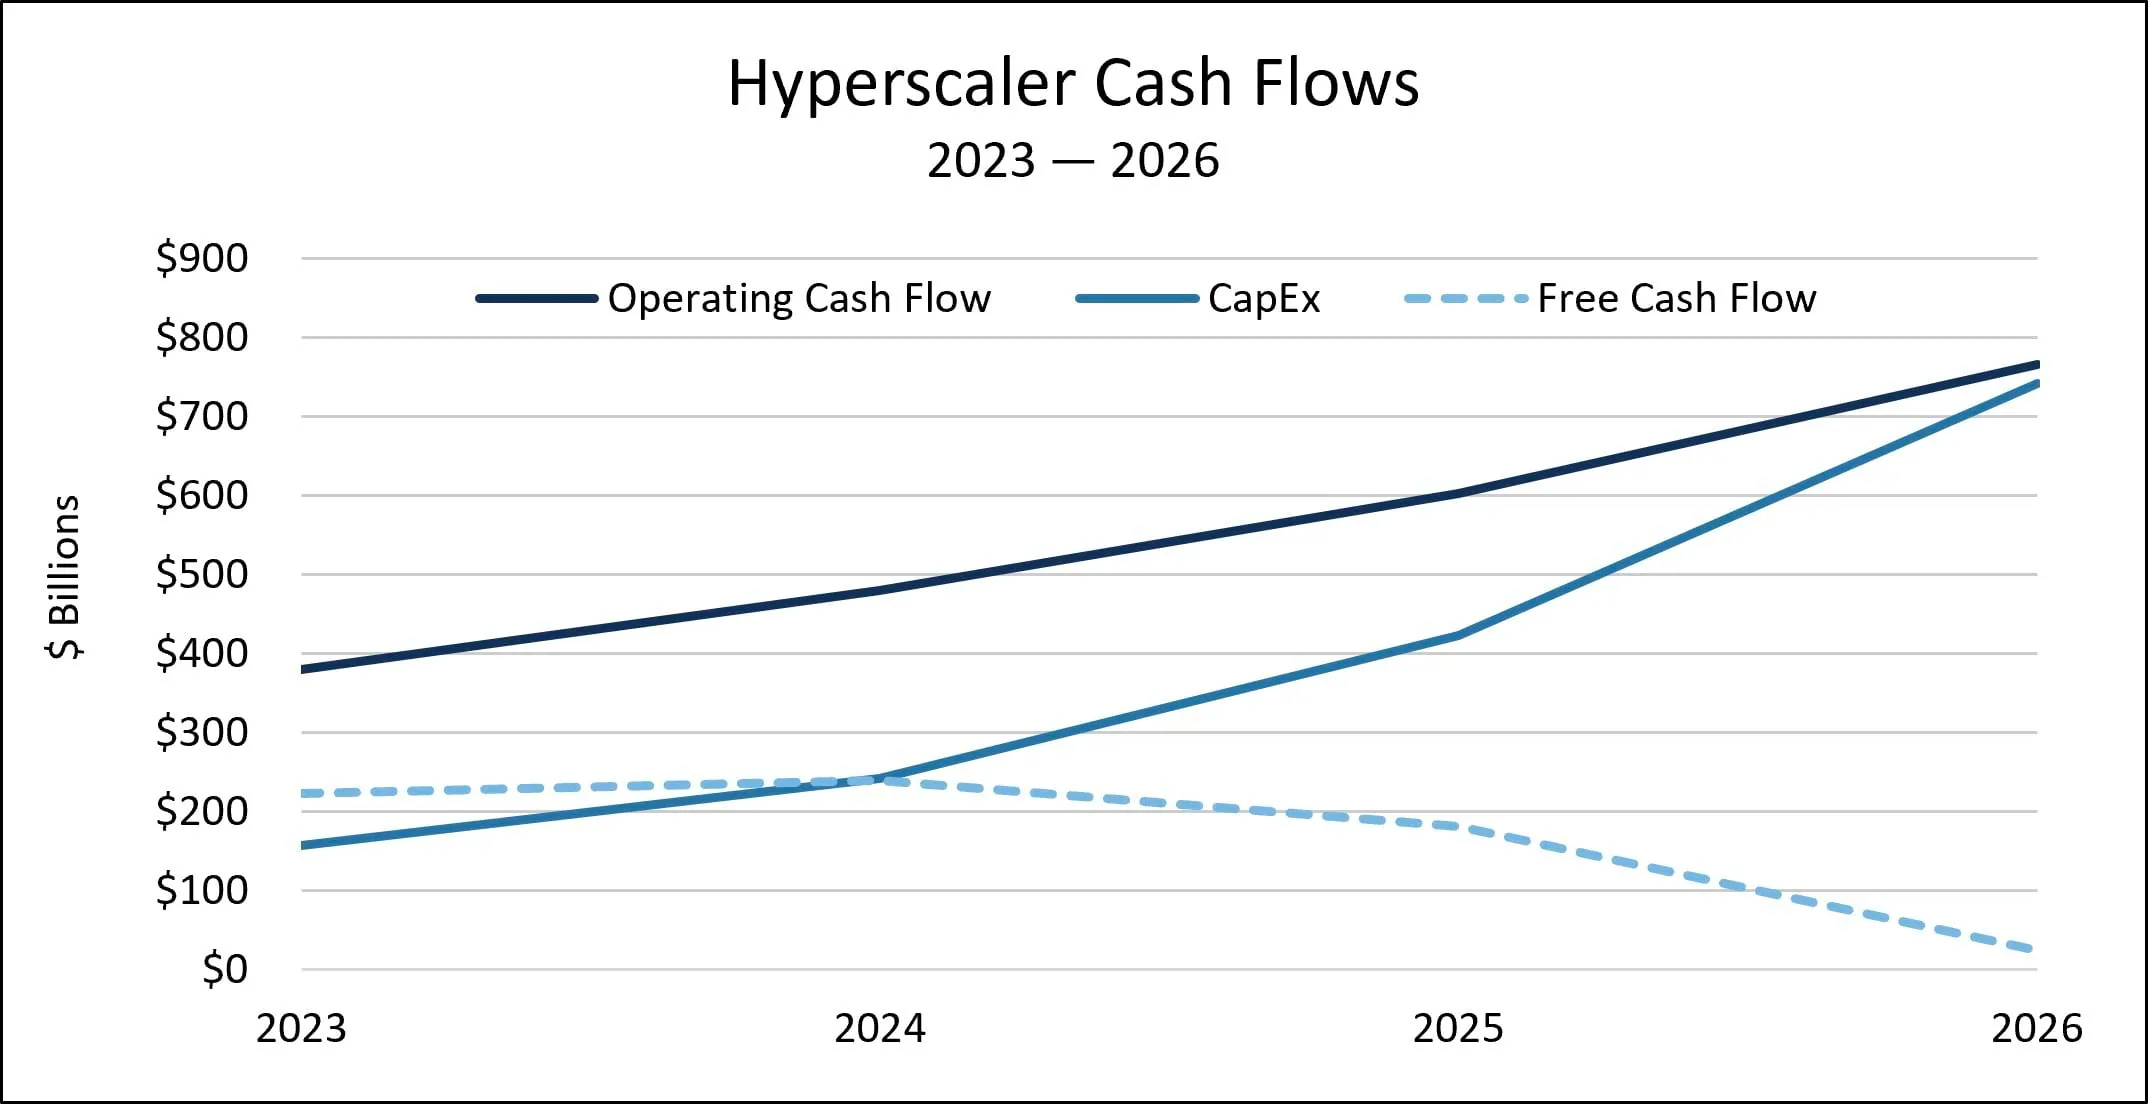
The second major change — in direct response to this surging demand — is that the large hyperscalers (Alphabet, Amazon, Microsoft, Meta, and Oracle) have begun reinvesting nearly all of their aggregate operating cash flows into capital expenditures (CapEx) to support blistering cloud growth driven by the AI boom. The management teams of these companies view investing in data centers — and the related semiconductors, power, and servers — as critical to the future of their businesses. To put into context the magnitude of this spend, consider that the five largest hyperscalers plan to invest roughly $740 billion of CapEx in 2026, about 75% higher than already record 2025 spending. The chart below shows how these businesses have collectively transitioned from enormous free cash flow generators as of 2023 (right before AI investment took off) to enterprises that now spend virtually all of their operating cash flow on their CapEx investments. The key question is when free cash flow generation will resume.
This mad dash to spend has meant that the hyperscalers now must rely on external sources of financing to cover their CapEx investments. In some cases, these companies have begun using substantial debt, even borrowing through somewhat murky off-balance sheet arrangements. Maybe most starkly, share repurchase has dramatically declined across the hyperscalers, and they have begun issuing primary equity to fund their investments — a total about face more typical of nascent startups than well-established, decades-old businesses. Importantly, however, the dividend payers in this group are maintaining their payouts.
Mega-IPO Mania: Funding Further Cash Burn
While the above shifts have been shocking in many ways, perhaps the most startling development is the raft of mega IPOs hitting the market. Consider SpaceX, which was the largest IPO in history. The company raised $75 billion in equity and now stands at a roughly $2 trillion equity valuation. Consensus Bloomberg estimates point to about $36 billion of revenue in 2026 and almost $100 billion of cumulative cash burn through 2028.
Piggybacking on the SpaceX offering, Anthropic and OpenAI are widely known to be planning their own IPOs. While Anthropic forecasts generating positive cash flow in 2028, OpenAI forecasts $111 billion of cash burn through 2030 before becoming cash flow positive. As a result, OpenAI is rumored to be pushing its IPO into 2027 due at least in part to investor concerns about the magnitude of the company’s sustained cash burn. IPOs are not the only way to bet on AI. In fact, excitement about the “AI trade” has led to rampant buying of leveraged ETFs, which saw assets nearly double over two months to $84 billion as of the end of May 2026, according to Goldman Sachs. Notably, leveraged ETFs can provide returns double or even triple the return of certain indices and stocks, creating dramatic upside but also potentially crippling downside.
The businesses that are coming to market in some cases have attractive unit economics with irreplaceable assets. And we do not doubt that the opportunity to generate revenue is massive. However, aggregate return on invested capital (ROIC), profitability, and valuation all matter in our view.
ROIC, Profitability, and Valuation: The Fundamentals That Still Matter
As our long-term clients know, we are perfectly comfortable investing in businesses with massive CapEx ramps, even those that temporarily lead to negative free cash flow. In fact, we have very successfully invested in many businesses over the decades during CapEx booms, and we are doing so today. But in every case, we underwrite a significant return on that invested capital. Critical to our analysis is our forecast of future profitability, normalized CapEx, and normalized cash flow generation after the CapEx bolus. Furthermore, valuation relative to normalized free cash flow is always key — we never want to pay an excessive price relative to free cash flow potential.
This brings us to the current environment. A select few hyperscalers have already begun demonstrating extremely attractive returns on investment, as revenue growth, profit margins, and operating cash flow have all improved significantly commensurate with CapEx for companies like Alphabet, Amazon, and Microsoft. For example, in the most recent quarter reported, Alphabet’s Cloud segment reported 33% operating margins — a dramatic improvement from the operating losses the segment was experiencing just over two years prior. And Amazon, which is reporting record growth and margins across its cloud and retail businesses, just announced it will raise prices on one of its AI compute offerings by 20%, on top of a 15% increase in January.
We are invested in this subset of hyperscalers, as they also maintain clean balance sheets and tend to pay growing dividends, an important signal of long-term discipline. Furthermore, these businesses have long histories of aggressively pursuing new investment opportunities and sacrificing near-term profitability for superior long-term cash flow generation and returns on capital.
We have also been selectively investing in semiconductors, with careful consideration of the sector’s historical boom and bust cycles. Years of underinvestment have left key components like memory chips and optical parts in severe shortage, sending prices to record highs. Rather than chase the whole sector, we are staying selective and sticking to the businesses we understand best and that have the most durable technological moats: compute and memory chips — controlled by just a handful of players — and the specialized equipment makers that every new chip factory must buy from.
On the other hand, we worry that many of the other businesses riding the AI boom — whether certain hyperscalers or new AI-native businesses — lack a clear path to profitability and/or are overly reliant on external financing that could dry up in a credit crunch.
Furthermore, valuations in some cases are eye wateringly high and appear detached from reality. This period reminds us of some of the cautionary tales from history and that we lived through more recently.
Consider RCA, the dominant tech company of its generation — an electronics business that was all the rage in the roaring 1920s. Shares reached a peak valuation of 72x earnings in 1929, then crashed and treaded water for three decades before regaining their previous highs. More recently, Cisco, the networking behemoth, traded to a high of 130x earnings in 2000 before massively correcting and did not regain its prior high until just a few months ago in December 2025. In both cases, these were dominant businesses, and Cisco remains a key networking player with significant advantages. But valuation matters, in addition to fundamentals. As we have long said, hopes and dreams can sometimes be priced by the market with stunning irrationality.
Final Thoughts
The AI boom will likely reverberate well into the future, and both companies and investors need to be well positioned for the massive changes forthcoming. We believe we own some of the businesses that will benefit significantly from the AI investment cycle, and, as always, we continue to adhere to our quality growth framework to ensure a disciplined approach to constructing portfolios.
As we have long said, growing per-share free cash flow generation is the key financial attribute we seek in our businesses and the ultimate reflection of a company’s durable competitive advantage. In addition, we look for businesses that reinvest to drive future growth and that we believe have excellent governance. This combination of three factors — durable competitive advantage reflected in growing free cash flow per share, reinvestment opportunity to drive growth, and strong governance — define a quality growth business for us. Once a company meets our standards, we invest in its shares if the valuation is attractive.
We believe that adhering to this framework should ensure excellent stewardship of client portfolios both in the current AI boom and through future cycles to come.
As always, we thank you for your continued confidence in our management.
John Osterweis
Founder, Chairman & Co-Chief Investment Officer – Core Equity
Gregory Hermanski
Co-Chief Investment Officer – Core Equity
Nael Fakhry
Co-Chief Investment Officer – Core Equity
Featuring
John Osterweis
Founder, Chairman & Co-Chief Investment Officer – Core Equity
John Osterweis founded Osterweis Capital Management to serve the portfolio needs of high-net-worth investors, foundations, and endowments. He is currently Chairman of the firm as well as a member of the firm’s Management Committee and a Portfolio Manager for the core equity, growth & income, and flexible balanced strategies.
After graduating from business school, John served as a Senior Analyst concentrating on the forest products and paper industry for several regional brokerage firms and later for E.F. Hutton & Company, Inc. In addition to his activities as an analyst, John served as Director of Research for two firms and managed equity portfolios for over ten years. In late 1982, John decided to devote himself full time to his portfolio management activities, and in April of 1983 launched Osterweis Capital Management.
John graduated from Bowdoin College (B.A. in Philosophy, cum laude), and Stanford Graduate School of Business (M.B.A. with top honors in Finance).
Outside of his work, John is an active supporter of our community. He has served as Director of the Lucas Museum of Narrative Art, Director on the Stanford Alumni Association Executive Board, Trustee of Bowdoin College, Director and Vice Chairman of Mt. Zion Hospital and Medical Center, and President of the Board of Directors for Summer Search Foundation. He currently serves as a Trustee of the San Francisco Ballet Association, Director of the San Francisco Free Clinic, and President Emeritus of the San Francisco Ballet Endowment Foundation, as well as Trustee Emeritus of Summer Search Foundation and of Bowdoin College. He also enjoys horseback riding and other outdoor activities.
Gregory Hermanski
Co-Chief Investment Officer – Core Equity
Greg Hermanski, a partner at Osterweis, is a Portfolio Manager for the core equity, growth & income, quality cyclical growth, and flexible balanced strategies. He enjoys working with his team to protect and grow our clients’ wealth. Greg feels that humility and discipline are key to succeeding in this industry and loves the continuous chance to learn as part of his role.
Prior to joining Osterweis in 2002, Greg was a Vice President at Robertson Stephens and Co. where he was in charge of convertible bond research. Prior to that, Greg was a Research Analyst covering convertible, high yield, and distressed securities at Imperial Capital, LLC, and a Valuation Consultant for Price Waterhouse, LLC.
Greg graduated from the University of California, Los Angeles with a B.A. in Business/Economics. Outside of work, he enjoys traveling, mountain biking, running, reading, and learning about history.

Nael Fakhry
Co-Chief Investment Officer – Core Equity
Nael Fakhry, a partner at Osterweis, is a Portfolio Manager for the core equity, growth & income, quality cyclical growth, and flexible balanced strategies. He loves the process of researching companies and studying the history of various industries.
Prior to joining Osterweis Capital Management in 2011, Nael worked as an Associate at American Securities, a private equity firm, and as an Analyst in the investment banking division of Morgan Stanley.
Nael graduated from Stanford University with a B.A. in History, Phi Beta Kappa and the University of California Berkeley, Walter A. Haas School of Business with an M.B.A., where he was a C.J. White Scholar. Outside of his professional life, Nael enjoys coaching his kids’ soccer and basketball teams, reading, and running. He also contributes to the community as Treasurer and member of the Board of Directors of the Burlingame Community Education Foundation, where he supports local education and helps manage the endowment.
For more information about this strategy, please send us an email or call us at (800) 700-3316.
Related Insights
Osterweis Fund Quarter-End Performance (as of 6/30/26)
| Fund | 1 MO | QTD | YTD | 1 YR | 3 YR | 5 YR | 10 YR | 15 YR | 20 YR |
INCEP (10/1/1993) |
|---|---|---|---|---|---|---|---|---|---|---|
| OSTFX | 0.91% | 11.03% | 5.84% | 14.08% | 13.93% | 6.72% | 10.84% | 9.48% | 8.29% | 10.37% |
| S&P 500 Index | -0.95% | 15.20% | 10.21% | 22.32% | 20.61% | 13.41% | 15.51% | 14.36% | 11.39% | 10.95% |
Gross expense ratio as of 3/31/26: 0.94%
Performance data quoted represent past performance; past performance does not guarantee future results. The investment return and principal value of an investment will fluctuate so that an investor’s shares, when redeemed, may be worth more or less than their original cost. Current performance of the Fund may be higher or lower than the performance quoted. Performance data current to the most recent month end may be obtained by calling shareholder services toll free at (866) 236-0050.
Rates of return for periods greater than one year are annualized.
Where applicable, charts illustrating the performance of a hypothetical $10,000 investment made at a Fund’s inception assume the reinvestment of dividends and capital gains, but do not reflect the effect of any applicable sales charge or redemption fees. Such charts do not imply any future performance. During the period noted, fee waivers or expense reimbursements were in effect for the Osterweis Fund.
The S&P 500 Index is widely regarded as the standard for measuring large cap U.S. stock market performance. The index does not incur expenses, is not available for investment, and includes the reinvestment of dividends.
References to specific companies, market sectors, or investment themes herein do not constitute recommendations to buy or sell any particular securities.
There can be no assurance that any specific security, strategy, or product referenced directly or indirectly in this commentary will be profitable in the future or suitable for your financial circumstances. Due to various factors, including changes to market conditions and/or applicable laws, this content may no longer reflect our current advice or opinion. You should not assume any discussion or information contained herein serves as the receipt of, or as a substitute for, personalized investment advice from Osterweis Capital Management.
Complete holdings of all Osterweis mutual funds (“Funds”) are generally available ten business days following quarter end. Holdings and sector allocations may change at any time due to ongoing portfolio management. Fund holdings as of the most recent quarter end are available here: Osterweis Fund
As of 6/30/26 the Osterweis Fund did not hold positions in SpaceX, Meta, OpenAI, Anthropic, Cisco, or Oracle.
The Osterweis Funds are available by prospectus only. The Funds’ investment objectives, risks, charges, and expenses must be considered carefully before investing. The summary and statutory prospectuses contain this and other important information about the Funds. You may obtain a summary or statutory prospectus by calling toll free at (866) 236-0050, or by visiting www.osterweis.com/statpro. Please read the prospectus carefully before investing to ensure the Fund is appropriate for your goals and risk tolerance.
Mutual fund investing involves risk. Principal loss is possible.
The Osterweis Fund may invest in medium and smaller sized companies, which involve additional risks such as limited liquidity and greater volatility. The Fund may invest in foreign and emerging market securities, which involve greater volatility and political, economic and currency risks and differences in accounting methods. These risks may increase for emerging markets. The Fund may invest in debt securities that are un-rated or rated below investment grade. Lower-rated securities may present an increased possibility of default, price volatility or illiquidity compared to higher-rated securities. Investments in debt securities typically decrease in value when interest rates rise.
Investment and insurance products are not FDIC or any other government agency insured, are not bank guaranteed, and may lose value.
No part of this article may be reproduced in any form, or referred to in any other publication, without the express written permission of Osterweis Capital Management.
This commentary contains the current opinions of the authors as of the date above, which are subject to change at any time, are not guaranteed, and should not be considered investment advice. This commentary has been distributed for informational purposes only and is not a recommendation or offer of any particular security, strategy, or investment product. Information contained herein has been obtained from sources believed to be reliable but is not guaranteed.
An exchange-traded fund (ETF) is a type of security that involves a collection of securities—such as stocks—that often tracks an index, although they can invest in any number of industry sectors or use various strategies.
Return on invested capital (ROIC) is a calculation used to assess a company’s efficiency at allocating the capital under its control to profitable investments.
Free cash flow represents the cash that a company is able to generate after laying out the money required to maintain and expand the company’s asset base. Free cash flow is important because it allows a company to pursue opportunities that enhance shareholder value.
Capital expenditures (CapEx) are funds used by a company to acquire, upgrade, and maintain physical assets such as property, plants, buildings, technology, or equipment.
Yield is the income return on an investment, such as the interest or dividends received from holding a particular security.
Operating profit margin is calculated by dividing a company’s net income (excluding interest, taxes, and other non-operating costs) by its net sales.
Spread is the difference in yield between a risk-free asset such as a Treasury bond and another security with the same maturity but of lesser quality.
Maturity is the date on which the life of a transaction or financial instrument ends, after which it must either be renewed, or it will cease to exist.
Coupon is the interest rate paid by a bond. The coupon is typically paid semiannually.
Investment grade/non-investment grade (high yield) categories and credit ratings breakdowns are based on ratings from agencies such as S&P, which is a private independent rating service that assigns grades to bonds to represent their credit quality. The issues are evaluated based on such factors as the bond issuer’s financial strength and its ability to pay a bond’s principal and interest in a timely fashion. S&P’s ratings are expressed as letters ranging from ‘AAA’, which is the highest grade, to ‘D’, which is the lowest grade. A rating of BBB- or higher is considered investment grade and a rating below BBB- is considered non-investment grade (high yield). Other credit ratings agencies include Moody’s and Fitch, each of whom may have different ratings systems and methodologies.
Osterweis Capital Management is the adviser to the Osterweis Funds, which are distributed by Quasar Distributors, LLC. [OCMI-967374-2026-07-14]
