What Market Selloff? Thank you, AI (and the Tariff Retreat)
As the market marches to new highs, just two months after a violent 20% selloff in equities, we ask ourselves how the narrative has shifted so quickly. Our simple answer is that economic fundamentals remain strong, with corporate profits rising, unemployment low, and inflation still under control for the moment. While the Trump administration threatened punishing tariffs that we believe risked an almost certain recession driven in part by the ensuing rampant inflation, the White House quickly retreated — leading to a snapback in equity prices. However, this still begs the question as to why the economy continues to grow and hence the stock market continues to move higher.
We believe the ever-expanding technology sector driven by the AI boom is playing a critical role in driving continued economic growth. We examine the role of AI in this outlook and conclude that direct participants and the broader economy are beginning to see a payoff, justifying the significant AI investments observed across sectors.
The AI Rollercoaster: Increasing Payoff Despite the Volatility
There have been several key milestones in the AI revolution over the past few years, most notably the public launch of ChatGPT in late 2022. But arguably the most critical recent milestone was the January 2025 release of DeepSeek’s Reasoning Large Language Model (LLM) R1. At the time, markets were roiled by the revolutionary Chinese LLM, which promised nearly the same performance of incumbent models at a small fraction of the cost. The question on everyone’s mind was whether DeepSeek would advance or impair the ability of technology companies to monetize AI and whether their enormous investments would ever see a payoff. Our analysis leads us to conclude that the pivotal DeepSeek moment helped unleash and accelerate the next wave of AI innovation while actually improving return on investment (ROI) on the enormous budgets being spent on LLMs.
Evolution of AI Scaling Laws
DeepSeek’s release demonstrated that highly capable AI models can be developed at a fraction of the previously estimated cost. With a reported spend of only $5.6 million for its final training run (roughly 95% cheaper than OpenAI’s o1 model), DeepSeek challenged the long-held belief that only tech giants with immense capital budgets could compete at the forefront of AI innovation. This revelation initially sparked considerable market volatility, particularly affecting semiconductor vendors and hyperscalers racing to build the next state-of-the-art model, as investors questioned the ROI and long-term sustainability of the massive capital expenditures directed towards building AI data centers in the U.S.
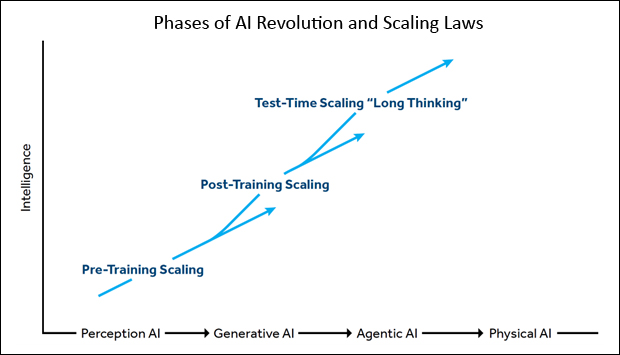
However, the industry swiftly reacted and adapted to the DeepSeek release, with the focus shifting towards a more sophisticated understanding of AI development. While pre-training of LLMs remains crucial, DeepSeek’s success highlighted the increasing importance of post-training and test-time scaling (see graphic below), which involves a series of steps deployed after feeding models with raw data to improve relevancy and specificity. Models are now able to break down complex tasks into smaller steps, explain each step, check for possible answers, and review their own rationales before coming up with a response. This has led to significant performance improvements and a focus on optimizing models for efficient and powerful reasoning capabilities that resemble how humans “think.”
In fact, the vast majority of state-of-the-art LLMs are now reasoning models that can think and reason like humans when tackling complex multi-step problems and tasks. Western AI labs have quickly caught up and even surpassed some of DeepSeek's initial benchmarks. Alphabet, for instance, has released two state-of-the-art reasoning models this year. OpenAI followed suit, releasing its newest mini models in mid-April 2025, simultaneously slashing costs by over 80% and further democratizing access to advanced AI capabilities.
Exponential Cost Reductions in Inferencing and Jevons Paradox
Jevons Paradox is the idea that when something becomes more efficient and cheaper to use, people end up using it even more. This principle has historically underpinned innovations across the tech industry — from semiconductor chips to the internet to ecommerce to cloud migration. So far, the current AI revolution is proving to be no exception, and DeepSeek has played a critical role. In fact, since the introduction of GPT-4 in March 2023, the costs of running AI queries have fallen by over 99%! It is now much cheaper and easier for consumers and businesses to use AI tools to analyze information, make predictions, and generate new content.
As a result of lower costs, there has been an explosion in how much information these LLMs are processing and how frequently they are being deployed. Nvidia’s CEO Jensen Huang recently emphasized this message. Models now routinely process over 100 trillion tokens (units of data processed by AI models), and a reasoning model can consume 20x more tokens and 150x more compute cycles compared to a non-reasoning model. This is evident in the dramatic increase in tokens processed by major tech companies like Alphabet, which recently reported processing a 50x year-over-year increase in tokens.
At the same time, capital expenditures for hyperscalers showed no signs of plateauing. Since the “DeepSeek moment,” major players have announced further increases in CapEx, most notably with the proposed $500 billion Stargate project by OpenAI and Softbank, alongside increased CapEx commitments from Alphabet, Meta, Oracle, and others. In fact, the Big Five Hyperscalers (Microsoft, Alphabet, Meta, Amazon, and Oracle) are expected to increase CapEx by 42% to over $350 billion in 2025, which will in turn translate to likely over 50% revenue growth for Nvidia in 2025, according to consensus estimates. Not only are hyperscalers and frontier AI labs still engaged in an arms race to achieve the ultimate goal of AGI (Artificial General Intelligence), they are also increasingly focused on serving the next wave of AI demand from the explosion of inferencing workloads.
Critically, we are now less concerned about the sheer magnitude of these CapEx investments, as we have increasing evidence of ROIs that are translating to accelerated revenue growth and improving profitability for hyperscalers:
- Microsoft reported a 33% year-over-year growth rate in Azure revenue in the most recent quarter, mostly driven by AI deployments.
- Alphabet’s Google Cloud segment has also been growing at approximately 30% year-over-year, and operating margins have dramatically improved from 9% to 18% in the past year, demonstrating increasing economies of scale.
- Amazon, the largest and most established cloud provider, reported revenue growth of 17% year-over-year in its most recent quarter, while generating record operating margins of 40% in the quarter.
- Oracle recently guided to cloud revenue growth of over 40% year-over-year in fiscal year 2026 and over 100% growth in their Remaining Performance Obligations (an indication of future revenue), which now stand at $270 billion.
Meanwhile, hyperscalers have continued to signal capacity constraints and demand outstripping supply, giving us confidence in the sustainability of growth and profitability well into the future.
Rapid Adoption of Agents and Increasing Productivity
With the exponential decline in inferencing costs, we have seen the rapid launch of agentic products and fast adoption of agents in the software space. Some prominent figures in the tech industry have declared 2025 as “the year of Agents,” whereby a wide array of AI agents can be seamlessly integrated into our daily personal and professional lives to improve our productivity and relieve us of tedious tasks.
Companies like Salesforce have demonstrated rapid iteration in product development. Agentforce 1.0 was released in September 2024, and the newest Agentforce 3.0 was just released in June 2025. Agentforce has won 8,000 deals to date, the fastest product ramp in Salesforce’s history. In May of this year, Alphabet rolled out its plan for a wide array of AI agents that can autonomously visit web pages, summarize content, or complete tasks like shopping, booking tickets, and making reservations.
As agents become an increasingly significant part of the workflow, higher productivity is becoming evident across industries. For example, Amazon has leveraged Amazon Q's code transformation capabilities to dramatically improve the efficiency of Java upgrades, resulting in significant savings of $260 million and a staggering 4,500 developer years. Amazon CEO Andy Jassy has even suggested that AI could lead to a decline in the number of Amazon employees over time, underscoring the transformative potential of AI on workforce dynamics and operational efficiency.
Not All Sunshine and Roses – AI’s Disruptive Power
We are well aware of the disruption that AI could potentially bring to existing business models. For example, software’s traditional model of per-seat, per-month subscription may take a hit with fewer people in the workforce. Hence, software companies are quickly adopting new revenue models such as charging on a consumption basis or offering AI credit packs to offset potential headwinds from seat compression. Concerns on Google’s search dominance were recently highlighted in Apple executive Eddy Cue’s testimony during Google’s antitrust trial, when he stated that Google searches on Apple’s Safari browser declined for the first time in 20 years. These are risks we monitor carefully.
Portfolio Positioning
We are diligently monitoring the rapidly evolving AI landscape to identify and invest in potential winners. We believe our equity portfolio is well positioned for secular growth in AI, with positions in what we consider to be the most valuable and defensible parts of the AI stack. This includes:
- Electronic Design Automation Companies: Synopsys (SNPS), a critical player for chip design and development.
- Semiconductor Vendors: Broadcom (AVGO) and Nvidia (NVDA), leaders in custom AI chips and GPUs.
- Big Tech and Hyperscalers: Microsoft (MSFT), Alphabet (GOOG) and Amazon (AMZN), companies that lead in AI innovation and provide critical cloud infrastructure for customers.
- Software Companies: Intuit (INTU) and Salesforce (CRM), companies that we think are going to emerge as AI winners, due to incumbency advantages and robust product roadmaps.
Despite rising geopolitical tensions and tariff-related macro concerns, we believe these companies are relatively insulated from these headwinds. Hence, we have treated bouts of market weakness as opportunities to tactically adjust and add to our positions, which reflect our long-term conviction in the transformative power of AI and our commitment to investing in quality growth companies.
Our quality growth framework remains consistent within our equity portfolio, regardless of the environment and shifts in the technology landscape. We continue to focus on businesses with the following three attributes: 1) durable competitive advantages that insulate against competition, 2) significant runway for growth via reinvestment, and 3) excellent governance. We seek to own a concentrated portfolio of these types of businesses, investing when valuations become attractive due to temporary headwinds. Ideally, we own these businesses for the long term, enjoying the twin benefits of significant annual profit growth and multiple expansion to drive attractive returns.
In our fixed income portfolio, we have been selectively deploying new capital given where yields are. We do not know when, but we know there will be another disruption in the market that could open up attractive entry points for us to utilize our ample liquidity to add positions at higher yields. In the meantime, we will continue looking for opportunities to invest in bonds that meet our criteria and provide acceptable risk/reward metrics for our investors.
We would like to acknowledge our team’s Senior Analyst Jasmine Shen for her significant contribution to the discussion on AI in this outlook. And, as always, we thank you for your continued confidence in our management.
John Osterweis
Founder, Chairman & Co-Chief Investment Officer – Core Equity
Gregory Hermanski
Co-Chief Investment Officer – Core Equity
Nael Fakhry
Co-Chief Investment Officer – Core Equity
Carl Kaufman
CIO – Strategic Income & Managing Director – Fixed Income
Featuring


John Osterweis
Founder, Chairman & Co-Chief Investment Officer – Core Equity
John Osterweis founded Osterweis Capital Management to serve the portfolio needs of high-net-worth investors, foundations, and endowments. He is currently Chairman of the firm as well as a member of the firm’s Management Committee and a Portfolio Manager for the core equity, growth & income, and flexible balanced strategies.
After graduating from business school, John served as a Senior Analyst concentrating on the forest products and paper industry for several regional brokerage firms and later for E.F. Hutton & Company, Inc. In addition to his activities as an analyst, John served as Director of Research for two firms and managed equity portfolios for over ten years. In late 1982, John decided to devote himself full time to his portfolio management activities, and in April of 1983 launched Osterweis Capital Management.
John graduated from Bowdoin College (B.A. in Philosophy, cum laude), and Stanford Graduate School of Business (M.B.A. with top honors in Finance).
Outside of his work, John is an active supporter of our community. He has served as Director of the Lucas Museum of Narrative Art, Director on the Stanford Alumni Association Executive Board, Trustee of Bowdoin College, Director and Vice Chairman of Mt. Zion Hospital and Medical Center, and President of the Board of Directors for Summer Search Foundation. He currently serves as a Trustee of the San Francisco Ballet Association, Director of the San Francisco Free Clinic, and President Emeritus of the San Francisco Ballet Endowment Foundation, as well as Trustee Emeritus of Summer Search Foundation and of Bowdoin College. He also enjoys horseback riding and other outdoor activities.


Gregory Hermanski
Co-Chief Investment Officer – Core Equity
Greg Hermanski, a partner at Osterweis, is a Portfolio Manager for the core equity, growth & income, quality cyclical growth, and flexible balanced strategies. He enjoys working with his team to protect and grow our clients’ wealth. Greg feels that humility and discipline are key to succeeding in this industry and loves the continuous chance to learn as part of his role.
Prior to joining Osterweis in 2002, Greg was a Vice President at Robertson Stephens and Co. where he was in charge of convertible bond research. Prior to that, Greg was a Research Analyst covering convertible, high yield, and distressed securities at Imperial Capital, LLC, and a Valuation Consultant for Price Waterhouse, LLC.
Greg graduated from the University of California, Los Angeles with a B.A. in Business/Economics. Outside of work, he enjoys traveling, mountain biking, running, reading, and learning about history.


Nael Fakhry
Co-Chief Investment Officer – Core Equity
Nael Fakhry, a partner at Osterweis, is a Portfolio Manager for the core equity, growth & income, quality cyclical growth, and flexible balanced strategies. He loves the process of researching companies and studying the history of various industries.
Prior to joining Osterweis Capital Management in 2011, Nael worked as an Associate at American Securities, a private equity firm, and as an Analyst in the investment banking division of Morgan Stanley.
Nael graduated from Stanford University with a B.A. in History, Phi Beta Kappa and the University of California Berkeley, Walter A. Haas School of Business with an M.B.A., where he was a C.J. White Scholar. Outside of his professional life, Nael enjoys coaching his kids’ soccer and basketball teams, reading, and running. He also contributes to the community as Treasurer and member of the Board of Directors of the Burlingame Community Education Foundation, where he supports local education and helps manage the endowment.


Carl Kaufman
CIO – Strategic Income & Managing Director – Fixed Income
Carl Kaufman has managed the Osterweis Strategic Income Fund since its inception and serves as the Managing Director of Fixed Income, as well as a Portfolio Manager for the Osterweis Growth & Income strategy. He is also a member of the firm’s Management Committee.
He joined Osterweis Capital Management in 2002, after nearly 24 years at Robertson Stephens and Merrill Lynch.
Carl graduated from Harvard University and attended New York University Graduate School of Business Administration.
Outside his professional endeavors, he enjoys playing classical piano and actively contributes to the community as a member of the Board of Trustees for the San Francisco Conservatory of Music, supporting the arts and enhancing the cultural fabric of the SF Bay Area. Additionally, he enjoys playing golf, an activity that continually challenges his patience and precision.
For more information about this strategy, please send us an email or call us at (800) 700-3316.
Related Insights
Growth & Income Fund Quarter-End Performance (as of 6/30/26)
| Fund | 1 MO | QTD | YTD | 1 YR | 3 YR | 5 YR | 7 YR | 10 YR | 15 YR |
INCEP (8/31/2010) |
|
|---|---|---|---|---|---|---|---|---|---|---|---|
| OSTVX | 1.16% | 8.07% | 5.77% | 11.74% | 11.32% | 6.12% | 9.24% | 9.04% | 8.37% | 9.09% | |
| 60% S&P 500 Index/40% Bloomberg U.S. Aggregate Bond Index | -0.47 | 9.31 | 6.45 | 14.76 | 13.92 | 8.10 | 10.19 | 9.98 | 9.62 | 10.17 | |
| S&P 500 Index | -0.95 | 15.20 | 10.21 | 22.32 | 20.61 | 13.41 | 16.08 | 15.51 | 14.36 | 15.34 | |
| Bloomberg U.S. Aggregate Bond Index | 0.24 | 0.67 | 0.62 | 3.79 | 4.16 | 0.08 | 1.22 | 1.54 | 2.28 | 2.25 | |
Gross expense ratio as of 3/31/26: 0.98%
Performance data quoted represent past performance; past performance does not guarantee future results. The investment return and principal value of an investment will fluctuate so that an investor’s shares, when redeemed, may be worth more or less than their original cost. Current performance of the Fund may be higher or lower than the performance quoted. Performance data current to the most recent month end may be obtained by calling shareholder services toll free at (866) 236-0050.
Rates of return for periods greater than one year are annualized.
Where applicable, charts illustrating the performance of a hypothetical $10,000 investment made at a Fund’s inception assume the reinvestment of dividends and capital gains, but do not reflect the effect of any applicable sales charge or redemption fees. Such charts do not imply any future performance. During the period noted, fee waivers or expense reimbursements were in effect for the Growth & Income Fund.
Source for any Bloomberg index is Bloomberg Index Services Limited. BLOOMBERG® is a trademark and service mark of Bloomberg Finance L.P. and its affiliates (collectively “Bloomberg”). Bloomberg owns all proprietary rights in the Bloomberg Indices. Bloomberg does not approve or endorse this material, or guarantees the accuracy or completeness of any information herein, or makes any warranty, express or implied, as to the results to be obtained therefrom and, to the maximum extent allowed by law, neither shall have any liability or responsibility for injury or damages arising in connection therewith.
The 60/40 blend is composed of 60% S&P 500 Index (S&P) and 40% Bloomberg U.S. Aggregate Bond Index (Agg) and assumes monthly rebalancing. The S&P is widely regarded as the standard for measuring large cap U.S. stock market performance. The Agg is widely regarded as a standard for measuring U.S. investment grade bond market performance. These indices do not incur expenses and are not available for investment. These indices include reinvestment of dividends and/or interest income.
References to specific companies, market sectors, or investment themes herein do not constitute recommendations to buy or sell any particular securities.
There can be no assurance that any specific security, strategy, or product referenced directly or indirectly in this commentary will be profitable in the future or suitable for your financial circumstances. Due to various factors, including changes to market conditions and/or applicable laws, this content may no longer reflect our current advice or opinion. You should not assume any discussion or information contained herein serves as the receipt of, or as a substitute for, personalized investment advice from Osterweis Capital Management.
Complete holdings of all Osterweis mutual funds (“Funds”) are generally available ten business days following quarter end. Holdings and sector allocations may change at any time due to ongoing portfolio management. Fund holdings as of the most recent quarter end are available here: Growth & Income Fund
The Osterweis Funds are available by prospectus only. The Funds’ investment objectives, risks, charges, and expenses must be considered carefully before investing. The summary and statutory prospectuses contain this and other important information about the Funds. You may obtain a summary or statutory prospectus by calling toll free at (866) 236-0050, or by visiting www.osterweis.com/statpro. Please read the prospectus carefully before investing to ensure the Fund is appropriate for your goals and risk tolerance.
Mutual fund investing involves risk. Principal loss is possible.
The Osterweis Growth & Income Fund may invest in small- and mid-capitalization companies, which tend to have limited liquidity and greater price volatility than large-capitalization companies. The Fund may invest in foreign and emerging market securities, which involve greater volatility and political, economic and currency risks and differences in accounting methods. These risks may increase for emerging markets. The Fund may invest in debt securities that are un-rated or rated below investment grade. Lower-rated securities may present an increased possibility of default, price volatility or illiquidity compared to higher-rated securities. Investments in debt securities typically decrease in value when interest rates rise. From time to time, the Fund may have concentrated positions in one or more sectors subjecting the Fund to sector emphasis risk. Investments in asset-backed and mortgage-backed securities include additional risks that investors should be aware of such as credit risk, prepayment risk, possible illiquidity and default, as well as increased susceptibility to adverse economic developments.
Operating profit margin is calculated by dividing a company’s net income (excluding interest, taxes, and other non-operating costs) by its net sales.
Investment and insurance products are not FDIC or any other government agency insured, are not bank guaranteed, and may lose value.
As of 6/30/25, the Osterweis Growth & Income Fund did not hold positions in Oracle, Meta, OpenAI, or DeepSeek.
No part of this article may be reproduced in any form, or referred to in any other publication, without the express written permission of Osterweis Capital Management.
This commentary contains the current opinions of the authors as of the date above, which are subject to change at any time, are not guaranteed, and should not be considered investment advice. This commentary has been distributed for informational purposes only and is not a recommendation or offer of any particular security, strategy, or investment product. Information contained herein has been obtained from sources believed to be reliable but is not guaranteed.
Osterweis Capital Management is the adviser to the Osterweis Funds, which are distributed by Quasar Distributors, LLC. [OCMI-769853-2025-07-14]
