2025 was a disquieting year for investors, as domestic policy gyrations and worrisome geopolitical developments created an elevated level of uncertainty. Yet, despite the troubling backdrop, investors gritted their teeth and continued buying – mainly due to a lack of volatility (save “Liberation Day”) and to a lesser degree, FOMO. This pushed a broad swath of markets, including precious metals, to their all-time highs, with only a brief respite in early April. It seemed as though nothing could derail the momentum of the bull market: not tariffs, war, government shutdowns, profligate fiscal largesse (and associated ballooning deficits), stubborn inflation, assaults on Fed independence, unbalanced labor markets, or slowing population growth. What all of this means for future returns will be important for investors, but we have written about most of these topics previously, so we won’t belabor them here. Rather, we look ahead to a few new themes that are emerging and share our thoughts on how we are approaching 2026.
Affordability
Much has been written recently about the lack of affordability for many large expenditures, such as housing and cars, but also for utility bills in some parts of the country. Affordability differs from inflation, although they are related. The more something rises in price, or stays at an elevated price, without income growing in line with those increases, the less affordable it becomes. This is important because it diverts resources away from other purchases, which over time can hamper overall economic growth. So far that does not seem to be the case.
Housing affordability has been described as a crisis in America. Below are charts of the FHFA House Price Index for the past two years and of average weekly earnings for the same period:
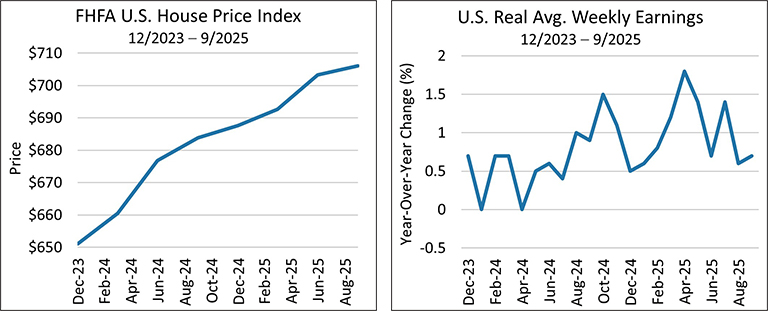
Chart 2 Source: Bloomberg. YoY Change, seasonally adjusted.
As you can see, income has not kept up with housing prices. Lower interest rates will not solve this problem, as prices are primarily a function of supply and demand (not exclusively interest rate levels), and in fact could make things worse by increasing demand, causing prices to move higher.
Similar patterns have emerged for automobile prices, which have risen quite a bit in the last five years for both new and used cars. Various sources estimate that the average cost of a new car over the same period rose 30% to ~$50,000, and the average price of a three-year-old used vehicle increased ~40% to ~$31,000. The average monthly car payment on a new car is now about $750. Lending terms are stretching beyond the typical five-year loan to six- and seven-year loans, with some up to 100 months (8+ years!). No wonder that the average age of cars on the road is now 12.8 years! This is not a healthy situation. Like the housing market, lower interest rates will not reduce car prices. Lower metal and manufacturing costs, combined with weaker demand, should do the trick.
K-Shaped Economy
This brings us to the next theme, the K-shaped economy. Simply put, the U.S. population can be divided between the “haves,” some top percentile, and the “have-nots,” everyone else. This is not a new concept, as we have always had these cohorts, but the terminology is new, perhaps due to a widening gap between the two. The high earners and wealthiest are largely insulated from the affordability crisis, given their higher incomes and increased wealth from their ever-expanding investment portfolios, but they may still exhibit more conservative buying patterns if news headlines remain unsettling. They are represented by the rising upper arm of the letter K. The lower-income cohort has not experienced a meaningful wealth effect from rising financial markets and are falling further behind, as wage growth has lagged price increases and savings are likely being tapped. They are represented by the declining lower arm of the letter K. Rising tides have not lifted all boats, despite reasonably healthy economic growth.
Data Integrity
Another challenge we are all dealing with is a decline in the quality of the data we rely on to understand what is happening in the economy. For example, Q3 Real GDP growth was a very positive surprise at 4.3%, vs. 3.8% in Q2. Ostensibly, the growth was driven by contributions from lower inventory drawdowns, strong exports, and real final sales, meaning consumer spending was robust despite the headwinds above. But in our view, the strong GDP growth feels overstated relative to what we are seeing in the economy, and we also expect it may be subject to significant revisions, as the government shutdown caused low data collection rates that forced the bean counters to make a number of subjective assumptions. Stay tuned.
We are seeing similar issues with other key economic indicators, including the latest CPI report, which diverged greatly from the GDP Price Index, an alternative inflation gauge also published by the Bureau of Labor Statistics (BLS). The Q3 GDP Price Index was 3.8% while the reported November CPI was 2.7%. Although they cover different time periods and use different methodologies, they are quite far apart, which demonstrates how recent first cuts of the data may be less reliable than usual. For example, in the CPI, goods price data collection rates were very low in November and skewed to the last two weeks of the month as price checkers got back to work. This period coincides with many Black Friday/Cyber Monday deals, which could be giving us a false reading for the entire month. Also, as Nick Timiraos of The WSJ pointed out, the BLS assumed that the change in Owners Equivalent Rent (OER), which is a BLS homeowner survey proxy for housing costs (accounting for a third of CPI) was zero for the month. This is very unlikely, but given its heavy weight in the CPI, and the low data collection rates during the shutdown, it was another potentially inflation-dampening input. More to come.
Fed Independence
Fed independence is another ongoing concern, and it appears to be eroding under intense pressure from the White House to lower rates, which happened again in December. Throughout history, past administrations have tried to influence the Fed, but today we have overtly partisan nominations of new Fed governors and a new Chairman next year who shares the administration’s desire to lower rates regardless of what the data would normally call for. We ask ourselves why the last cut was needed given that the economy is reasonably healthy and many equity markets are near all-time highs? Perhaps even the Fed doesn’t believe in the integrity of the numbers? Add to that, commodity prices for some metals, such as gold and silver, are also breaking records. Granted, these are not as heavily used in industry as other metals, so some speculative hedging of currencies or safe-haven bets against the degradation of the dollar may be at work here. Also, Arbor Research points out that roughly 65% of the gains in gold occurred during Asian trading hours, suggesting Asian central banks are large buyers of the precious metal, as illustrated in the chart below:
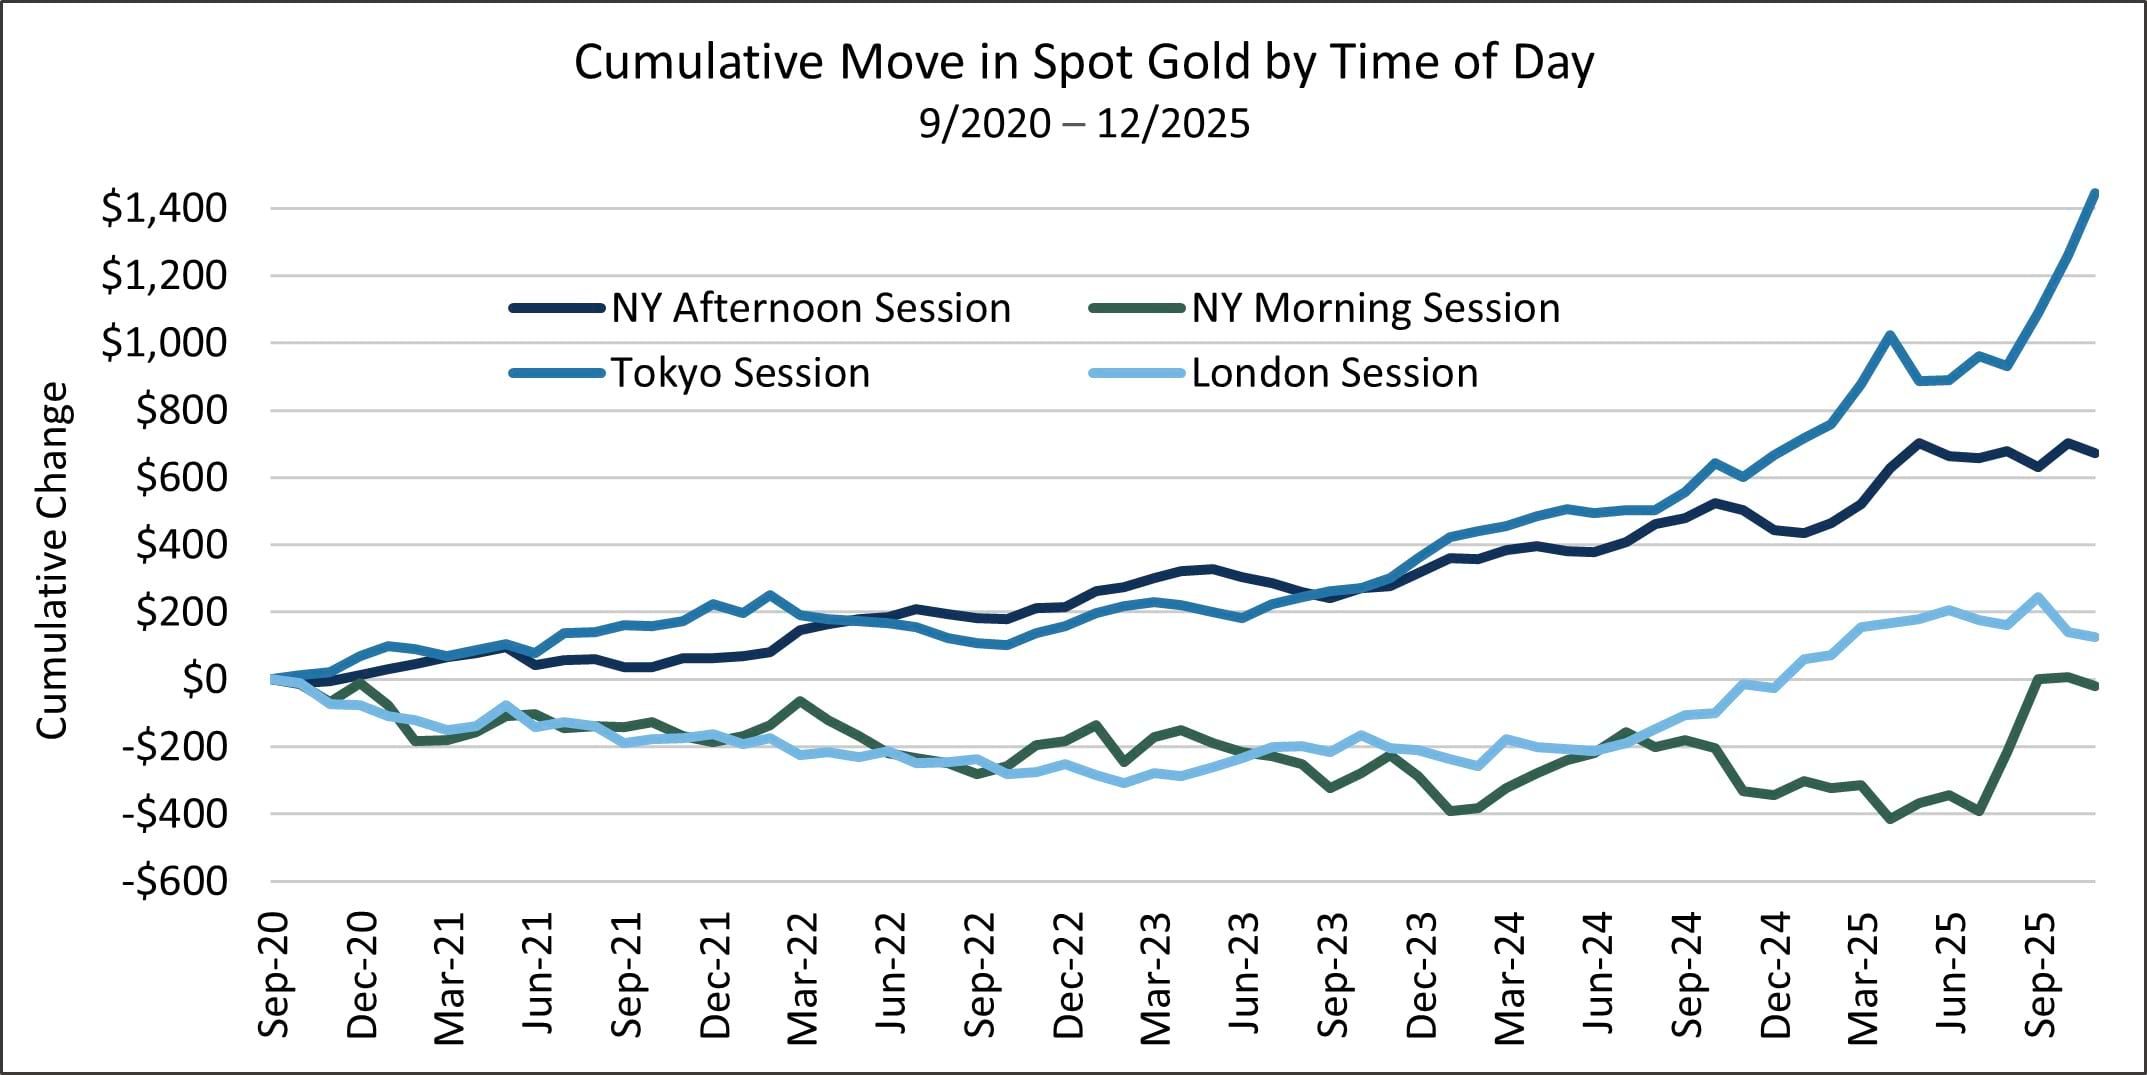
Silver, which has broken all-time price records, retreated a bit during the last days of the year, but in keeping with the 2025 bullish action, quickly recovered.
The utility function for copper and aluminum is real, because they are widely used in manufacturing and housing. While off from its pandemic highs, aluminum has seen its price increase substantially over the last two years and copper has seen a similar rise, as shown in the charts below:
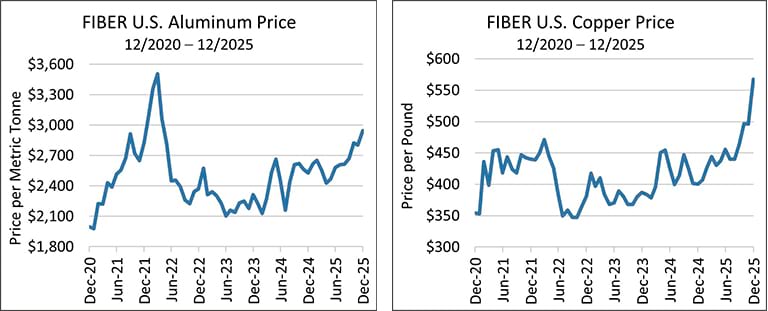
These are not speculative vehicles like gold and sometimes silver, but real economic inputs to manufacturing. Our conclusion is that supply is inadequate to meet economic demand. Does this look like the appropriate backdrop to increase economic stimulus? We do not think so.
Clearly the Fed is now focusing on its full employment mandate. However, evidence is scant that there is a large problem here. Job creation has been a bit slower than it has been historically, but given that the population/labor pool (i.e., the denominator for the unemployment rate) may be shrinking due to the administration’s aggressive immigration policies, it can rise even without big changes in the number of unemployed people. This implies that we could be near full employment, despite the unemployment rate drifting higher. Moreover, the number of job openings nationwide is very close to the total number of unemployed. As the JOLTs data below shows, job openings have remained fairly flat over the past year, and even though the total number of those facing unemployment has increased, it is still roughly equivalent to the available openings (note: the largest rise in unemployed workers occurred during the recent government shutdown – coincidence?):
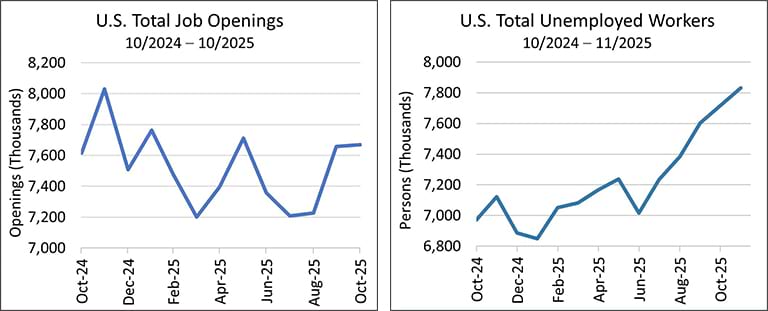
Chart 2 Source: Bloomberg. In labor force, seasonally adjusted.
This situation indicates a skills mismatch, which should close in time, or we may continue to experience a structural skills mismatch and slightly higher unemployment. We hope for the former.
Final Thoughts
What does this mean for 2026 and beyond? There is considerable uncertainty given questions related to affordability, the K-shaped economy, data integrity, and the ability of the Fed to navigate a challenging landscape. As always, we are focusing on what we know.
If history is a guide, returns for future periods following the current high valuations in equity markets could be subdued at best. Not many would argue that stocks are cheap now, although there are some sector differences. We have shown the tables below before, but they bear repeating. For the period following 2000, equity returns lagged high yield bond returns for many years. We show five-, ten-, and 20-year annualized returns for major asset classes following the 2000 peak (the green shaded areas represent periods when high yield was the best performing asset class):
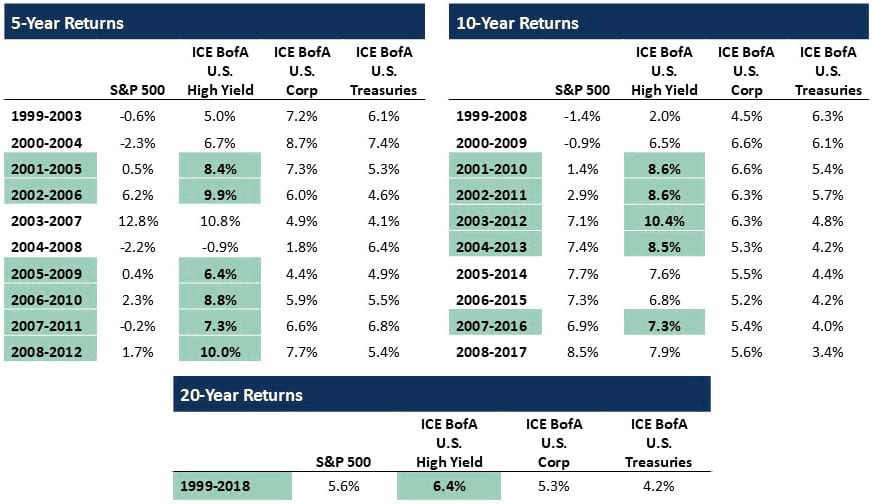
Quite eye opening.
Our view is that there are times when investors should favor a more defensive posture. We believe that this may be one of those times. As the saying goes, “trees do not grow to the sky,” and given the robust performance we have experienced in equities, precious metals, and some international and emerging markets, perhaps it is time to count one’s blessings, put some chips in the bank, and wait for better opportunities. We may have taken a defensive posture too early and missed some upside in 2025, but returns were acceptable, and we slept a little easier knowing the proverbial investment sword of Damocles was not hanging over our heads.
We will wait for better entry points in the new year. There are some cracks emerging, such as the recent selloff in crypto and some AI-related sectors. Also, on December 29th silver plunged, although it recovered quickly, so hopefully we are getting closer to seeing more rationality in prices. While we do not know what the future will bring, we are skeptical that the torrid pace of valuation expansion we have seen in some sectors (e.g., AI, nuclear) is sustainable or repeatable. Therefore, we are cautiously optimistic that we can avoid a major collapse, but fearful that future returns could be anemic. We are keeping a healthy buying reserve and focusing on companies that can weather the storm, if that’s what is coming, or thrive in a more balanced economy and orderly repricing.
Here's to continued progress in 2026! We thank you for your confidence in our management.
Carl Kaufman
CIO – Strategic Income & Managing Director – Fixed Income
Bradley Kane
Vice President & Portfolio Manager – Strategic Income
Craig Manchuck
Vice President & Portfolio Manager – Strategic Income
John Sheehan, CFA
Vice President & Portfolio Manager – Strategic Income
Featuring


Carl Kaufman
CIO – Strategic Income & Managing Director – Fixed Income
Carl Kaufman has managed the Osterweis Strategic Income Fund since its inception and serves as the Managing Director of Fixed Income, as well as a Portfolio Manager for the Osterweis Growth & Income strategy. He is also a member of the firm’s Management Committee.
He joined Osterweis Capital Management in 2002, after nearly 24 years at Robertson Stephens and Merrill Lynch.
Carl graduated from Harvard University and attended New York University Graduate School of Business Administration.
Outside his professional endeavors, he enjoys playing classical piano and actively contributes to the community as a member of the Board of Trustees for the San Francisco Conservatory of Music, supporting the arts and enhancing the cultural fabric of the SF Bay Area. Additionally, he enjoys playing golf, an activity that continually challenges his patience and precision.


Bradley Kane
Vice President & Portfolio Manager – Strategic Income
Bradley (Brad) Kane is a Portfolio Manager for the strategic income strategy and a partner at the firm. In his role he leverages his extensive experience and deep understanding of the market to seek out opportunities to deliver clients attractive risk-adjusted returns.
Prior to joining Osterweis in 2013, Brad was a Portfolio Manager and Analyst at Newfleet Asset Management, where he managed both high yield and leveraged loan portfolios. Before that, he was a Vice President at GSC Partners, focusing on management of high yield and collateralized debt obligations. Earlier in his career, he managed high yield assets as a Vice President at Mitchell Hutchins Asset Management. In these positions he learned the importance of staying focused on one’s investing strategy and discovering new securities and investor types without succumbing to trends.
Brad graduated from Lehigh University with a B.S. in Business & Economics. Outside of his professional life, he enjoys playing golf and ice hockey, as well as indulging in his diverse taste in music, including a particular appreciation for heavy metal.


Craig Manchuck
Vice President & Portfolio Manager – Strategic Income
Craig Manchuck, a partner at Osterweis, is a Portfolio Manager for the strategic income strategy. In this role he enjoys investing clients’ assets in a common sense way that is designed to generate good risk-adjusted returns. Throughout his career, Craig has learned the importance of patience and that relationships with company management teams are invaluable.
Prior to joining Osterweis Capital Management in 2017, Craig was a Managing Director of Fixed Income Sales at Stifel Nicolaus, where he was responsible for sales and origination of high yield bonds, leveraged loans, and post reorg equities. Before Stifel, he held a similar role at Knight Capital. Before that, Craig was the Executive Director for Convertible Securities and then High Yield/Distressed Securities at UBS. He has previous experience in Convertible Securities Sales at Donaldson, Lufkin & Jenrette, SBC Warburg, and Merrill Lynch.
Craig graduated from Lehigh University with a B.S. in Finance and NYU Stern School of Business with an M.B.A. Outside of work, he enjoys golfing, wine, gardening, and spending time with family.


John Sheehan, CFA
Vice President & Portfolio Manager – Strategic Income
John Sheehan, a partner at Osterweis, is a Portfolio Manager for the strategic income strategy. In his role he appreciates the opportunity to contribute to clients feeling confident that their investments are positioned to meet their long-term goals. As a portfolio manager, he likes that the bond market is an ever-evolving game that blends art and science.
Prior to joining the Strategic Income team at the end of 2023, John was a portfolio manager for the total return strategy. Before that, he spent more than 20 years working at Citigroup, first as Managing Director responsible for Investment Grade Syndicate in New York City, where he advised issuers on accessing funding in the corporate bond market. Later at Citigroup, he was Managing Director in charge of West Coast Investment Grade Sales in San Francisco, where he covered several of the largest U.S. investment grade credit investors.
John graduated from Georgetown University with a B.A. in Economics. He holds the CFA designation and is a member of the CFA Society of San Francisco. Outside of work, John enjoys swimming and skiing with his family, as well as seeing live music.
For more information about this strategy, please send us an email or call us at (800) 700-3316.
Related Insights
The Osterweis Funds are available by prospectus only. The Funds’ investment objectives, risks, charges, and expenses must be considered carefully before investing. The summary and statutory prospectuses contain this and other important information about the Funds. You may obtain a summary or statutory prospectus by calling toll free at (866) 236-0050, or by visiting www.osterweis.com/statpro. Please read the prospectus carefully before investing to ensure the Fund is appropriate for your goals and risk tolerance.
Mutual fund investing involves risk. Principal loss is possible.
The Osterweis Strategic Income Fund may invest in debt securities that are un-rated or rated below investment grade. Lower-rated securities may present an increased possibility of default, price volatility or illiquidity compared to higher-rated securities. The Fund may invest in foreign securities, which involve greater volatility and political, economic and currency risks and differences in accounting methods. Investments in debt securities typically decrease in value when interest rates rise. This risk is usually greater for longer-term debt securities. Small- and mid-capitalization companies tend to have limited liquidity and greater price volatility than large-capitalization companies. From time to time, the Fund may have concentrated positions in one or more sectors subjecting the Fund to sector emphasis risk.
Investment and insurance products are not FDIC or any other government agency insured, are not bank guaranteed, and may lose value.
No part of this article may be reproduced in any form, or referred to in any other publication, without the express written permission of Osterweis Capital Management.
This commentary contains the current opinions of the authors as of the date above, which are subject to change at any time, are not guaranteed, and should not be considered investment advice. This commentary has been distributed for informational purposes only and is not a recommendation or offer of any particular security, strategy, or investment product. Information contained herein has been obtained from sources believed to be reliable but is not guaranteed.
Current and future holdings are subject to risk.
Performance data quoted represent past performance; past performance does not guarantee future results. The investment return and principal value of an investment will fluctuate so that an investor’s shares, when redeemed, may be worth more or less than their original cost. Current performance of the Fund may be higher or lower than the performance quoted. Performance data current to the most recent month end may be obtained by calling shareholder services toll free at (866) 236-0050.
The FHFA HPI® is a comprehensive collection of publicly available house price indices that measure changes in single-family home values based on data that extend back to the mid-1970s from all 50 states and over 400 American cities.
The U.S. Real Average Weekly Earnings Index measures usual weekly earnings of wage and salary workers. Wage and salary workers are workers who receive wages, salaries, commissions, tips, payment in kind, or piece rates, excluding all self-employed persons.
The Gross Domestic Product Price Index measures changes in the prices of goods and services produced in the United States, including those exported to other countries. Prices of imports are excluded.
Owners’ Equivalent Rent of Residences (OER) and rent of primary residence (rent) measure most of the change in the shelter cost consumers experience within the CPI.
Consumer Price Index (CPI) reflects the weighted average of prices of a basket of consumer goods and services, such as transportation, food, and medical care. There is typically a one-month lag in the measure due to the release schedule from the U.S. Bureau of Labor Statistics.
The Job Openings and Labor Turnover Survey (JOLTS) program produces data on job openings, hires, and separations.
The U.S. Unemployment Rate represents the number of unemployed as a percentage of the labor force.
Investment grade/non-investment grade (high yield) categories and credit ratings breakdowns are based on ratings from agencies such as S&P, which is a private independent rating service that assigns grades to bonds to represent their credit quality. The issues are evaluated based on such factors as the bond issuer’s financial strength and its ability to pay a bond’s principal and interest in a timely fashion. S&P’s ratings are expressed as letters ranging from ‘AAA’, which is the highest grade, to ‘D’, which is the lowest grade. A rating of BBB- or higher is considered investment grade and a rating below BBB- is considered non-investment grade (high yield). Other credit ratings agencies include Moody’s and Fitch, each of whom may have different ratings systems and methodologies.
Gross Domestic Product (GDP) is the monetary value of all the finished goods and services produced within a country’s borders in a specific time period.
Yield is the income return on an investment, such as the interest or dividends received from holding a particular security. A yield curve is a graph that plots bond yields vs. maturities, at a set point in time, assuming the bonds have equal credit quality. In the U.S., the yield curve generally refers to that of Treasuries.
The S&P 500 Index is widely regarded as the standard for measuring large cap U.S. stock market performance. The index does not incur expenses, is not available for investment, and includes the reinvestment of dividends.
ICE BofA U.S. Corporate Index tracks the performance of U.S. dollar denominated investment grade corporate debt publicly issued in the U.S. domestic market.
The ICE BofA U.S. High Yield Index tracks the performance of U.S. dollar denominated below-investment grade corporate debt publicly issued in the U.S. domestic market.
ICE BofA U.S. Treasury Index tracks the performance of U.S. dollar denominated sovereign debt publicly issued by the U.S. government in its domestic market. Issues must carry a term to maturity of at least one year, a fixed coupon schedule, and a minimum amount outstanding of $1 billion.
Effective 6/30/22, the ICE indices reflect transactions costs. Any ICE index data referenced herein is the property of ICE Data Indices, LLC, its affiliates (“ICE Data”) and/or its Third Party Suppliers and has been licensed for use by Osterweis Capital Management. ICE Data and its Third Party Suppliers accept no liability in connection with its use. See https://www.osterweis.com/glossary for a full copy of the Disclaimer.
These indices do not incur expenses (unless otherwise noted) and are not available for investment.
Morgan Stanley Precious Metals Index is published by Morgan Stanley for institutional research purposes and includes the spot price of gold across different geographies and at different times of day.
Foundation for International Business and Economic Research (FIBER) U.S. Commodity Aluminum Spot Price tracks the spot price of aluminum in USD/metric tonne.
Foundation for International Business and Economic Research (FIBER) U.S. Commodity Copper Spot Price tracks the spot price of copper in USD/pound.
Osterweis Capital Management is the adviser to the Osterweis Funds, which are distributed by Quasar Distributors, LLC. [OCMI-862620-2026-01-09]
