Risk assets performed exceptionally well in the second quarter. The S&P 500 rallied an eye-popping 15% during the period, which was its best return since the second quarter of 2020. Similarly, high yield bonds had a strong quarter as robust corporate earnings helped on both sides of the balance sheet. U.S. Treasury returns notably lagged, as Fed watchers flipped from hoping for rate cuts to fearing rate hikes. The returns during the second quarter were a stark reversal from the first quarter, which saw the S&P 500 decline by over 4% and fixed income return roughly zero, particularly considering that economic fundamentals were relatively similar during the two periods. In our view, the best explanation for the turnaround is that investors’ perception of the risks shifted – essentially, the glass was half empty in the first quarter but half full in the second.
In our previous outlook, Everything Everywhere All at Once, we outlined the seemingly unending list of challenges that caused markets to struggle during the first quarter, including evolving tariff policies, a DOJ investigation into the Fed Chair, AI breakthroughs that triggered a massive software selloff, a partial government shutdown, and the war in Iran as well as other geopolitical tensions. In the second quarter, investors seemed to ignore most of those concerns (and the government shutdown ended), focusing instead on two issues – the war in Iran, which they concluded was less impactful than initially feared, and the massive amounts of AI-related CapEx undertaken by the hyperscalers, which was deemed a tailwind rather than a headwind.
Looking first at the implications of the war, oil closed at $65 per barrel on the last trading session before the U.S. and Israel launched large-scale strikes on Iranian targets. Oil quickly spiked to $113 by April 7th, as the market was rightly concerned about potentially losing 20% of the world’s oil exports in addition to a meaningful supply of other commodities, including fertilizer. This type of supply shock and price spike has led to recessions in the past and ranks high as a market risk factor, so why were investors unfazed?
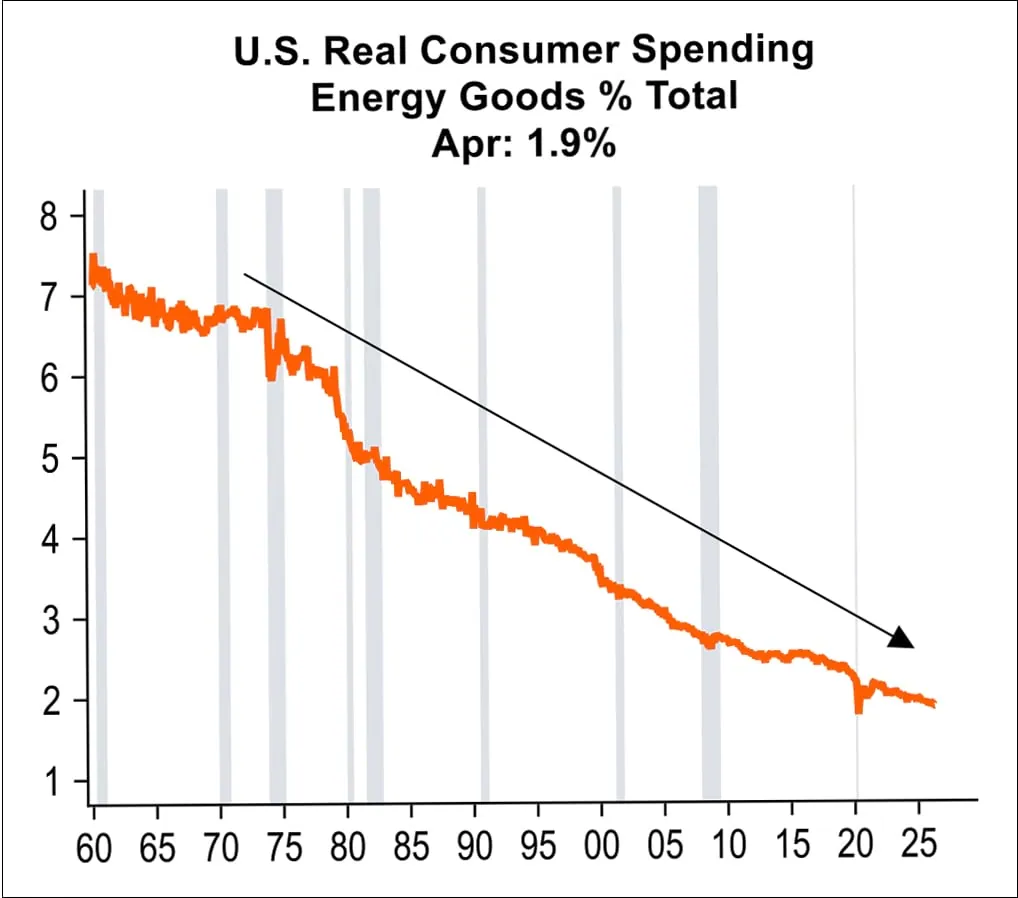
From the consumer’s perspective, the price of gas is one of the few assets that does not psychologically adjust with inflation. It has marginally outpaced inflation over the last 30 years, while other expenses like healthcare and higher education are significantly higher. As a result, the percentage of consumer spending on energy is roughly half of its peak in the 1980s. While the daily media barrage might impact their psyche, energy does not have the same impact on consumers’ wallets as we have grown up believing. We feel this is the main reason markets were able to shrug off the oil shock, combined with the fact that most observers felt the price spike would normalize fairly quickly once hostilities ended.
The other big storyline in the second quarter, which may have even been more impactful than the war, was the ongoing investment in AI by the hyperscalers (e.g., Microsoft, Alphabet, Amazon, Oracle, and Meta). Although some of those individual companies saw their share prices decline during the period, broadly speaking markets treated the AI investment cycle as a tailwind, particularly for hardware, software, and infrastructure companies that directly benefit from the data center buildout.
We appreciate this perspective, as the capital investment in AI infrastructure is the largest that we have seen in thirty years, but we think the exuberance of the second quarter oversimplifies the situation. Even though the current investment level as a percentage of GDP is comparable to other transformational investment cycles, such as the telecom buildout in the 1990s, that cycle resulted in excess capacity and over-investment, which serves as a reminder of the risk of AI repeating the same mistake. Moreover, we are still in the early stages of this buildout, so the ultimate AI spend may eventually surpass all others.
Even if the current buildout does not result in excess capacity, the sheer scale of the CapEx investment is transforming the capital markets, which we believe could become problematic in the future. AI/data center-related issuance has exceeded $300 billion this year. The issuers have tapped virtually every corner of the capital markets, with the largest portion of the funding coming from the investment grade debt market. This is to be expected given the strength of the hyperscalers’ balance sheets but much of the issuance has been structured to remain at arm’s length from the ultimate issuer. If business/profits do not develop it will be interesting to see how these special purpose vehicles perform for investors. In the equity market, SpaceX raised $75 billion in the largest IPO ever (later upsized to ~$86 billion), and Alphabet, the parent of Google, raised $80 billion in an equity and equity-linked offering. It is notable – and worth watching – that the hyperscalers have gone from significant buyers of their own stock (via share buybacks) to sellers of their stock (via secondary offerings).
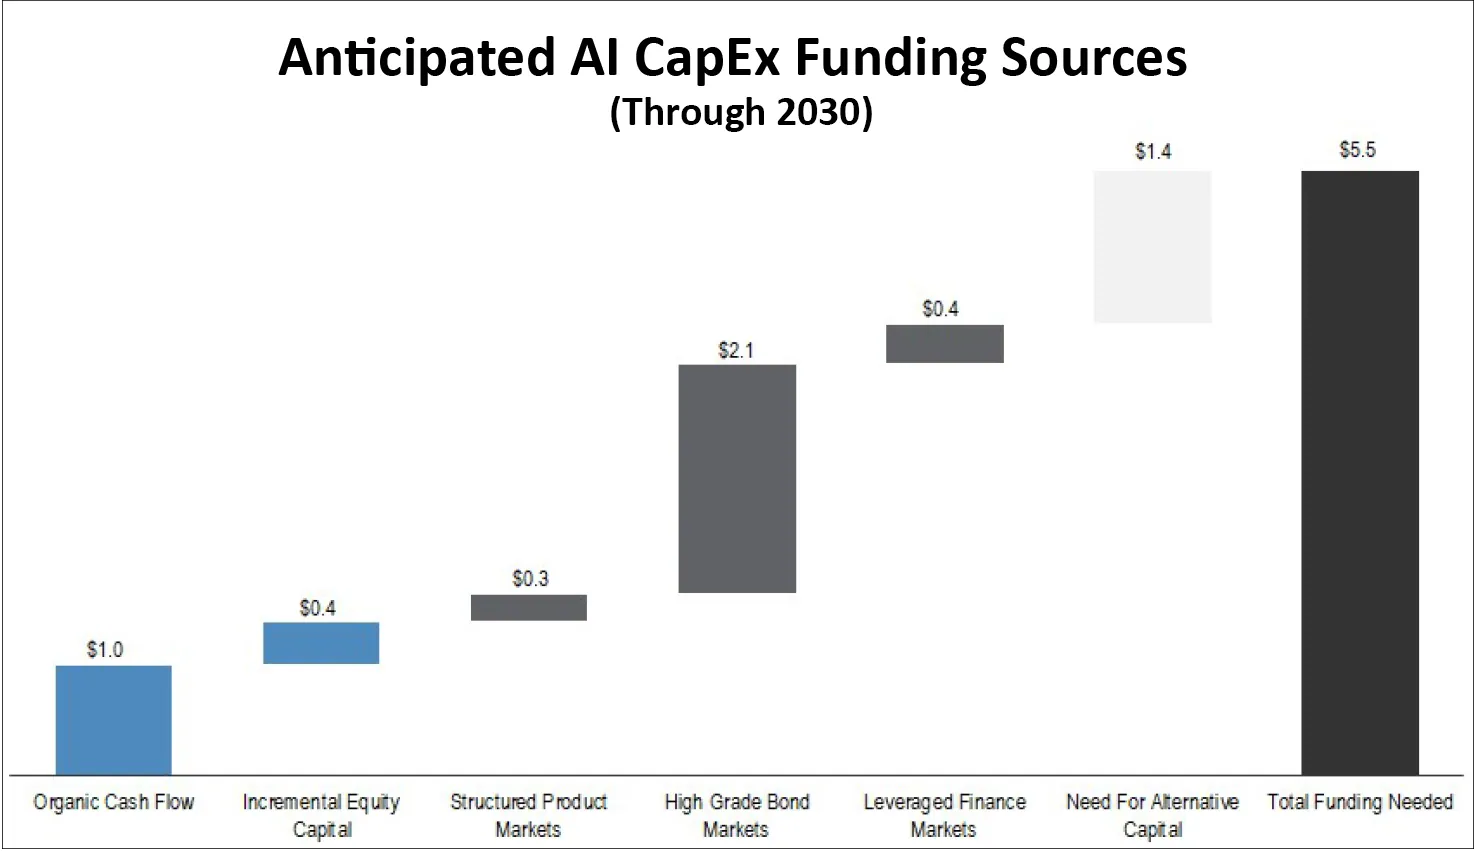
Looking forward, J.P. Morgan estimates that total AI CapEx spending could reach $5.5 trillion by 2030. If this plays out as expected, there will be a steady supply in all capital markets. They expect approximately $2.8 trillion to be issued across the public and private debt markets, including investment grade, leveraged finance (e.g., high yield and leveraged loans), and structured products. This still leaves $1.4 trillion of additional need for alternative capital to finance. To put that into perspective, that amount is approximately the size of the entire high yield market today!
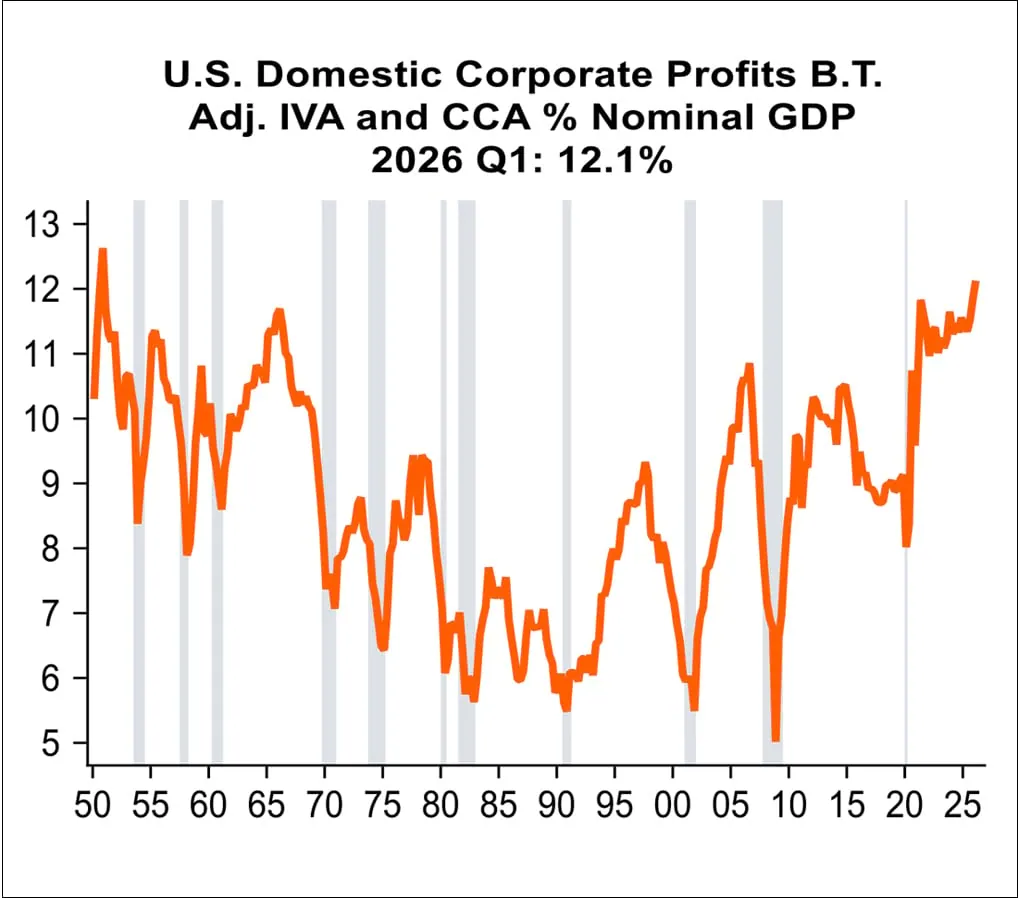
For now, the ongoing wave of hyperscaler CapEx has lifted profits, and U.S. corporations are doing exceptionally well. The tax cuts in the 2025 Budget Act have certainly helped their bottom line, and they have been able to navigate and/or pass along the tariffs to consumers. This has led to year-over-year S&P 500 earnings growth of 27%, and corporate profits are growing significantly faster than the economy. As the chart below shows, corporate profits as a percentage of GDP are at the highest level in the past 40 years and have risen significantly since the COVID-induced slowdown. From this perspective, risk markets appear to be appropriately responding to earnings growth, and the strong performance in the second quarter is reasonable. This is not to say the problems with excessive debt are behind us, but rather they will ebb and flow from month to month.
Looking forward, we are optimistic that the high yield market will continue to be the sweet spot in fixed income. The quality of the index has steadily improved, as nearly 60% is now BB rated, versus ~40% in 2007, while the CCC component is now ~9% vs ~18% in 2007. This means that credit risk metrics are as good as they have ever been. However, we remain cautious that markets may not float on optimism in perpetuity, and we are carefully monitoring multiple risk factors. First, the secondary effects of the war in Iran and subsequent closing of the Strait of Hormuz have not yet been fully realized. One area in particular is the supply of fertilizer, which is not as easy to replace as oil. This certainly has the potential to lead to further food inflation, which could keep inflation higher for longer. Similar to gas prices, food prices are viewed by consumers as a proxy for overall inflation, and this can lead to a deterioration in consumer confidence.
Moreover, U.S. Treasury supply continues to increase in order to fund growing deficits, which will keep upward pressure on rates. The new Fed Chair Kevin Warsh has already been on record expressing concerns around price stability, so he may adopt a more restrictive policy or potentially tighten the balance sheet. As discussed above, the investment grade market is expected to see substantial supply from AI-related issuance, which could replace banks as the largest sector in the Bloomberg U.S. Aggregate Index.
Likewise, we would be remiss not to touch upon private credit. The number of private credit funds that announce redemption requests in excess of their quarterly gates continues to rise, and the past quarter was no exception. We remain bearish on the asset class, and we anticipate defaults and write downs will increase materially at some point. Medallia is a recent example where the sponsor wrote off nearly $5 billion in equity, and private funds who owned the debt were also hurt.
All of these concerns lead us to reinforce our cautious portfolio positioning. We will continue to avoid areas of the market where we do not observe favorable risk/return relationships, and we will focus on companies with strong balance sheets run by responsible management teams.
As always, we thank you for your confidence in our management and we look forward to hearing from you.
Carl Kaufman
CIO – Strategic Income & Managing Director – Fixed Income
Bradley Kane
Vice President & Portfolio Manager – Strategic Income
Craig Manchuck
Vice President & Portfolio Manager – Strategic Income
John Sheehan, CFA
Vice President & Portfolio Manager – Strategic Income
Featuring


Carl Kaufman
CIO – Strategic Income & Managing Director – Fixed Income
Carl Kaufman has managed the Osterweis Strategic Income Fund since its inception and serves as the Managing Director of Fixed Income, as well as a Portfolio Manager for the Osterweis Growth & Income strategy. He is also a member of the firm’s Management Committee.
He joined Osterweis Capital Management in 2002, after nearly 24 years at Robertson Stephens and Merrill Lynch.
Carl graduated from Harvard University and attended New York University Graduate School of Business Administration.
Outside his professional endeavors, he enjoys playing classical piano and actively contributes to the community as a member of the Board of Trustees for the San Francisco Conservatory of Music, supporting the arts and enhancing the cultural fabric of the SF Bay Area. Additionally, he enjoys playing golf, an activity that continually challenges his patience and precision.


Bradley Kane
Vice President & Portfolio Manager – Strategic Income
Bradley (Brad) Kane is a Portfolio Manager for the strategic income strategy and a partner at the firm. In his role he leverages his extensive experience and deep understanding of the market to seek out opportunities to deliver clients attractive risk-adjusted returns.
Prior to joining Osterweis in 2013, Brad was a Portfolio Manager and Analyst at Newfleet Asset Management, where he managed both high yield and leveraged loan portfolios. Before that, he was a Vice President at GSC Partners, focusing on management of high yield and collateralized debt obligations. Earlier in his career, he managed high yield assets as a Vice President at Mitchell Hutchins Asset Management. In these positions he learned the importance of staying focused on one’s investing strategy and discovering new securities and investor types without succumbing to trends.
Brad graduated from Lehigh University with a B.S. in Business & Economics. Outside of his professional life, he enjoys playing golf and ice hockey, as well as indulging in his diverse taste in music, including a particular appreciation for heavy metal.


Craig Manchuck
Vice President & Portfolio Manager – Strategic Income
Craig Manchuck, a partner at Osterweis, is a Portfolio Manager for the strategic income strategy. In this role he enjoys investing clients’ assets in a common sense way that is designed to generate good risk-adjusted returns. Throughout his career, Craig has learned the importance of patience and that relationships with company management teams are invaluable.
Prior to joining Osterweis Capital Management in 2017, Craig was a Managing Director of Fixed Income Sales at Stifel Nicolaus, where he was responsible for sales and origination of high yield bonds, leveraged loans, and post reorg equities. Before Stifel, he held a similar role at Knight Capital. Before that, Craig was the Executive Director for Convertible Securities and then High Yield/Distressed Securities at UBS. He has previous experience in Convertible Securities Sales at Donaldson, Lufkin & Jenrette, SBC Warburg, and Merrill Lynch.
Craig graduated from Lehigh University with a B.S. in Finance and NYU Stern School of Business with an M.B.A. Outside of work, he enjoys golfing, wine, gardening, and spending time with family.


John Sheehan, CFA
Vice President & Portfolio Manager – Strategic Income
John Sheehan, a partner at Osterweis, is a Portfolio Manager for the strategic income strategy. In his role he appreciates the opportunity to contribute to clients feeling confident that their investments are positioned to meet their long-term goals. As a portfolio manager, he likes that the bond market is an ever-evolving game that blends art and science.
Prior to joining the Strategic Income team at the end of 2023, John was a portfolio manager for the total return strategy. Before that, he spent more than 20 years working at Citigroup, first as Managing Director responsible for Investment Grade Syndicate in New York City, where he advised issuers on accessing funding in the corporate bond market. Later at Citigroup, he was Managing Director in charge of West Coast Investment Grade Sales in San Francisco, where he covered several of the largest U.S. investment grade credit investors.
John graduated from Georgetown University with a B.A. in Economics. He holds the CFA designation and is a member of the CFA Society of San Francisco. Outside of work, John enjoys swimming and skiing with his family, as well as seeing live music.
For more information about this strategy, please send us an email or call us at (800) 700-3316.
Related Insights
The Osterweis Funds are available by prospectus only. The Funds’ investment objectives, risks, charges, and expenses must be considered carefully before investing. The summary and statutory prospectuses contain this and other important information about the Funds. You may obtain a summary or statutory prospectus by calling toll free at (866) 236-0050, or by visiting www.osterweis.com/statpro. Please read the prospectus carefully before investing to ensure the Fund is appropriate for your goals and risk tolerance.
Mutual fund investing involves risk. Principal loss is possible.
The Osterweis Strategic Income Fund may invest in debt securities that are un-rated or rated below investment grade. Lower-rated securities may present an increased possibility of default, price volatility or illiquidity compared to higher-rated securities. The Fund may invest in foreign securities, which involve greater volatility and political, economic and currency risks and differences in accounting methods. Investments in debt securities typically decrease in value when interest rates rise. This risk is usually greater for longer-term debt securities. Small- and mid-capitalization companies tend to have limited liquidity and greater price volatility than large-capitalization companies. From time to time, the Fund may have concentrated positions in one or more sectors subjecting the Fund to sector emphasis risk.
References to specific companies, market sectors, or investment themes herein do not constitute recommendations to buy or sell any particular securities.
Investment and insurance products are not FDIC or any other government agency insured, are not bank guaranteed, and may lose value.
No part of this article may be reproduced in any form, or referred to in any other publication, without the express written permission of Osterweis Capital Management.
This commentary contains the current opinions of the authors as of the date above, which are subject to change at any time, are not guaranteed, and should not be considered investment advice. This commentary has been distributed for informational purposes only and is not a recommendation or offer of any particular security, strategy, or investment product. Information contained herein has been obtained from sources believed to be reliable but is not guaranteed.
Current and future holdings are subject to risk.
As of 6/30/26 the Osterweis Strategic Income Fund did not hold positions in Amazon, Oracle, Alphabet, Microsoft, Meta, Medallia, or SpaceX.
Gross Domestic Product (GDP) is the monetary value of all the finished goods and services produced within a country’s borders in a specific time period.
Investment grade/non-investment grade (high yield) categories and credit ratings breakdowns are based on ratings from agencies such as S&P, which is a private independent rating service that assigns grades to bonds to represent their credit quality. The issues are evaluated based on such factors as the bond issuer’s financial strength and its ability to pay a bond’s principal and interest in a timely fashion. S&P’s ratings are expressed as letters ranging from ‘AAA’, which is the highest grade, to ‘D’, which is the lowest grade. A rating of BBB- or higher is considered investment grade and a rating below BBB- is considered non-investment grade (high yield). Other credit ratings agencies include Moody’s and Fitch, each of whom may have different ratings systems and methodologies.
Yield is the income return on an investment, such as the interest or dividends received from holding a particular security.
Capital expenditures (CapEx) are funds used by a company to acquire, upgrade, and maintain physical assets such as property, plants, buildings, technology, or equipment.
Treasuries are securities sold by the federal government to consumers and investors to fund its operations. They are all backed by “the full faith and credit of the United States government” and thus are considered free of default risk.
The Bloomberg U.S. Aggregate Bond Index (Agg) is widely regarded as the standard for measuring U.S. investment grade bond market performance. This index does not incur expenses and is not available for investment. The index includes reinvestment of dividends and/or interest income.
Source for any Bloomberg index is Bloomberg Index Services Limited. BLOOMBERG® is a trademark and service mark of Bloomberg Finance L.P. and its affiliates (collectively “Bloomberg”). Bloomberg owns all proprietary rights in the Bloomberg Indices. Bloomberg does not approve or endorse this material, or guarantees the accuracy or completeness of any information herein, or makes any warranty, express or implied, as to the results to be obtained therefrom and, to the maximum extent allowed by law, neither shall have any liability or responsibility for injury or damages arising in connection therewith.
The S&P 500 Index is widely regarded as the standard for measuring large cap U.S. stock market performance. The index does not incur expenses, is not available for investment, and includes the reinvestment of dividends.
Capital consumption adjustment aligns the depreciation reported on business tax returns with true economic depreciation (at current replacement cost and consistent service lives).
Inventory valuation adjustment corrects discrepancies between the physical inventory on hand and the recorded financial value in the general ledger.
Osterweis Capital Management is the adviser to the Osterweis Funds, which are distributed by Quasar Distributors, LLC. [OCMI-964337-2026-07-09]
