Of the many newsworthy events and policy changes over the past quarter, few, if any, have rattled the markets. Consequently, the quarter was calm and the S&P 500 Index continued to make new highs, turning in a stellar performance – up 8.12% – with very little volatility. In fact, following the Liberation Day spike, volatility measures have retreated to levels just above the post-Covid lows seen in 2023 and 2024, suggesting widespread complacency.
One possible explanation for this optimism was that investors expected the Fed to cut the fed funds rate, which would stimulate the markets and the economy. While this was certainly a factor, which we will discuss more below, we believe a bigger driver was that solid earnings growth continued in the third quarter following a robust second quarter. Moreover, the impact of tariffs (of which few were enacted in Q2) has been very modest thus far, as many companies frontloaded inventory. This allowed second quarter earnings to be much higher than the dire forecasts that were made in April. As a result, a wide swath of financial assets performed well and, as Isaac Newton posited: bodies in motion stay in motion. For now.
In fact, as you can see from the table below, most market indicators were favorable during the period, as bond yields fell (i.e., prices rose), equities rallied, spreads tightened, and volatility declined.
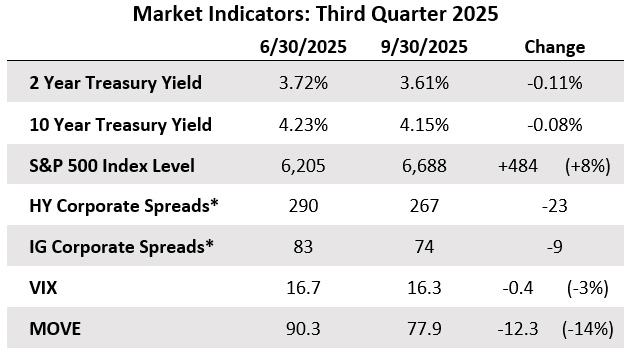
*Spreads are in basis points and reflect the Bloomberg U.S. High Yield and Investment Grade Corporate indices.
In high yield, the increased proportion of BB-rated bonds, now representing ~55% of the index, has helped to improve the overall credit quality of the index but has also made it more interest rate sensitive than in the past. Since the BB cohort typically carries lower spreads, more akin to the BBB bonds in the investment grade universe, comparing overall spreads today to past eras can be a bit misleading. That said, given the lower spreads in fixed income and higher equity valuations, it would not be surprising to see more muted returns from here barring further help from the Fed.
It is hard to find compelling reasons for us to justify moving away from our current defensive posture. Anecdotally, we are seeing increasing signs of froth in the markets. The investments in AI-themed names in both the venture capital world and in the public markets are but one example. The mostly paper wealth creation among those early-stage investors has been staggering, and it is fueling prodigious follow-on investment into the sector.
For fixed income investors, the AI-themed names are a cohort that exists largely outside our investment purview (although we did have one very successful investment in an AI-related convertible, which we exited at the end of 2024). Most of the AI-themed names are private, VC-owned cash burners that are not prime candidates for borrowing in the credit markets. The few that have come to market to borrow have very dubious credit profiles and have asked lenders to invest largely based on their future prospects. This is a sensible arrangement for equity holders, who receive unlimited upside in exchange for the risk they take, but for bondholders it is far less appealing, as their upside is limited to the coupon they receive while the risk is the same. We are, however, carefully monitoring this because we believe it is an apt barometer for broad investor sentiment, which is unabashedly risk-on.
The hyperscalers are budgeting hundreds of billions of dollars of CapEx to build data centers, which they hope will power a massive expansion of AI adoption in the years ahead. The numbers are astonishing, and the hype and activity around AI reminds us of the excitement around all things dot-com and dark fiber in the 1990s. The birth of the internet was a society-changing phenomenon, and AI could prove to be the same. However, it is unlikely that AI adoption will pan out exactly as planned. Given the lofty valuations ascribed to these early-stage, unproven companies, any deviation from the expected adoption rate and the ensuing revenue forecasts (many of which are still years away) could trigger at least a tremor, and possibly a much larger quake as winners and losers are parsed by the market. Stay tuned.
Another big market tailwind in the third quarter was the ever “watched pot” of Fed policy. When the Fed finally decided to cut the federal funds rate target by 25 basis points on September 18th, it was about as surprising as seeing the sun rise in the east. Traditional fixed income managers have been leaning into this cut for months, and the softening of the labor market finally gave the Fed the leeway it needed to make the move, despite data that show inflation is still exceeding the Fed’s long-held 2% target. In their dual mandate, there is no clear regulatory preference in weight given to keeping inflation in check or maintaining a stable job market, but inflation concerns over the last three years have clearly taken precedence. The recently elevated focus on the job market, potentially at the expense of inflation vigilance, could have meaningful implications regarding the shape of the yield curve going forward.
The lead up to the September meeting saw the 10-year Treasury rally nearly 35 basis points from 4.34% to 3.99%, before closing at 4.02% the day before the meeting. That enthusiasm was short lived. We have argued for the last few years that a decline in short rates does not necessarily precede a correspondent decline in longer rates. Recency bias surely plays a part in investors’ expectations about this as the period from 2008-2022 was the only extended period where the 10-year yield stayed below 4% since 1960. Otherwise, a 10-year Treasury yield above 4% puts it into what can be considered a “normal” range over the last 60+ years.
Now with a Fed focused mainly on the job market, it would seem to us the door has been left ajar for the bond vigilantes to utilize the diminished focus on inflation to take a run at the long end of the curve and drive up rates. Arguments are being posited that further cuts run the risk of overstimulating the economy and reigniting the inflationary fire that the Fed sought to quell beginning with its 2022 hiking regime. As such, we still think the 10-year Treasury will be range-bound for the foreseeable future between 4.0 – 4.5%. That makes the risk/reward tradeoff of extending duration skew negatively at current levels, particularly for higher-rated issues, which carry lower yields and are more interest sensitive.
As has often happened in the past during strong bull markets in credit, we have allowed our cash and cash-like investments to grow. New issue activity in both the investment grade and high yield bond markets has been robust, but coupons offered have been mostly unattractive at the time of issuance. Fortunately, we are still finding some opportunities in non-benchmark issues, more complex stories, or first-time issuers, where we are getting paid appropriately to extend maturities. In the meantime, we are being very careful to avoid the potholes and making sure not to stretch (accepting more credit risk) while chasing yield.
We are very patient and exercise a disciplined approach to entry points in bonds we have on our extensive watch list. Additionally, given how relatively flat the yield curve is in high yield, we are giving up very little yield today by holding short-duration assets while we wait for better entry points. Our portfolio positioning is designed to help us avoid significant drawdowns during market disruptions and should enable us to act quickly when better broad buying opportunities present themselves.
Thank you for your continued confidence in our management.
Carl Kaufman
CIO – Strategic Income & Managing Director – Fixed Income
Bradley Kane
Vice President & Portfolio Manager – Strategic Income
Craig Manchuck
Vice President & Portfolio Manager – Strategic Income
John Sheehan, CFA
Vice President & Portfolio Manager – Strategic Income
Featuring


Carl Kaufman
CIO – Strategic Income & Managing Director – Fixed Income
Carl Kaufman has managed the Osterweis Strategic Income Fund since its inception and serves as the Managing Director of Fixed Income, as well as a Portfolio Manager for the Osterweis Growth & Income strategy. He is also a member of the firm’s Management Committee.
He joined Osterweis Capital Management in 2002, after nearly 24 years at Robertson Stephens and Merrill Lynch.
Carl graduated from Harvard University and attended New York University Graduate School of Business Administration.
Outside his professional endeavors, he enjoys playing classical piano and actively contributes to the community as a member of the Board of Trustees for the San Francisco Conservatory of Music, supporting the arts and enhancing the cultural fabric of the SF Bay Area. Additionally, he enjoys playing golf, an activity that continually challenges his patience and precision.


Bradley Kane
Vice President & Portfolio Manager – Strategic Income
Bradley (Brad) Kane is a Portfolio Manager for the strategic income strategy and a partner at the firm. In his role he leverages his extensive experience and deep understanding of the market to seek out opportunities to deliver clients attractive risk-adjusted returns.
Prior to joining Osterweis in 2013, Brad was a Portfolio Manager and Analyst at Newfleet Asset Management, where he managed both high yield and leveraged loan portfolios. Before that, he was a Vice President at GSC Partners, focusing on management of high yield and collateralized debt obligations. Earlier in his career, he managed high yield assets as a Vice President at Mitchell Hutchins Asset Management. In these positions he learned the importance of staying focused on one’s investing strategy and discovering new securities and investor types without succumbing to trends.
Brad graduated from Lehigh University with a B.S. in Business & Economics. Outside of his professional life, he enjoys playing golf and ice hockey, as well as indulging in his diverse taste in music, including a particular appreciation for heavy metal.


Craig Manchuck
Vice President & Portfolio Manager – Strategic Income
Craig Manchuck, a partner at Osterweis, is a Portfolio Manager for the strategic income strategy. In this role he enjoys investing clients’ assets in a common sense way that is designed to generate good risk-adjusted returns. Throughout his career, Craig has learned the importance of patience and that relationships with company management teams are invaluable.
Prior to joining Osterweis Capital Management in 2017, Craig was a Managing Director of Fixed Income Sales at Stifel Nicolaus, where he was responsible for sales and origination of high yield bonds, leveraged loans, and post reorg equities. Before Stifel, he held a similar role at Knight Capital. Before that, Craig was the Executive Director for Convertible Securities and then High Yield/Distressed Securities at UBS. He has previous experience in Convertible Securities Sales at Donaldson, Lufkin & Jenrette, SBC Warburg, and Merrill Lynch.
Craig graduated from Lehigh University with a B.S. in Finance and NYU Stern School of Business with an M.B.A. Outside of work, he enjoys golfing, wine, gardening, and spending time with family.


John Sheehan, CFA
Vice President & Portfolio Manager – Strategic Income
John Sheehan, a partner at Osterweis, is a Portfolio Manager for the strategic income strategy. In his role he appreciates the opportunity to contribute to clients feeling confident that their investments are positioned to meet their long-term goals. As a portfolio manager, he likes that the bond market is an ever-evolving game that blends art and science.
Prior to joining the Strategic Income team at the end of 2023, John was a portfolio manager for the total return strategy. Before that, he spent more than 20 years working at Citigroup, first as Managing Director responsible for Investment Grade Syndicate in New York City, where he advised issuers on accessing funding in the corporate bond market. Later at Citigroup, he was Managing Director in charge of West Coast Investment Grade Sales in San Francisco, where he covered several of the largest U.S. investment grade credit investors.
John graduated from Georgetown University with a B.A. in Economics. He holds the CFA designation and is a member of the CFA Society of San Francisco. Outside of work, John enjoys swimming and skiing with his family, as well as seeing live music.
For more information about this strategy, please send us an email or call us at (800) 700-3316.
Related Insights
The Osterweis Funds are available by prospectus only. The Funds’ investment objectives, risks, charges, and expenses must be considered carefully before investing. The summary and statutory prospectuses contain this and other important information about the Funds. You may obtain a summary or statutory prospectus by calling toll free at (866) 236-0050, or by visiting www.osterweis.com/statpro. Please read the prospectus carefully before investing to ensure the Fund is appropriate for your goals and risk tolerance.
Mutual fund investing involves risk. Principal loss is possible.
The Osterweis Strategic Income Fund may invest in debt securities that are un-rated or rated below investment grade. Lower-rated securities may present an increased possibility of default, price volatility or illiquidity compared to higher-rated securities. The Fund may invest in foreign securities, which involve greater volatility and political, economic and currency risks and differences in accounting methods. Investments in debt securities typically decrease in value when interest rates rise. This risk is usually greater for longer-term debt securities. Small- and mid-capitalization companies tend to have limited liquidity and greater price volatility than large-capitalization companies. From time to time, the Fund may have concentrated positions in one or more sectors subjecting the Fund to sector emphasis risk.
This commentary contains the current opinions of the authors as of the date above, which are subject to change at any time, are not guaranteed, and should not be considered investment advice. This commentary has been distributed for informational purposes only and is not a recommendation or offer of any particular security, strategy, or investment product. Information contained herein has been obtained from sources believed to be reliable but is not guaranteed.
No part of this article may be reproduced in any form, or referred to in any other publication, without the express written permission of Osterweis Capital Management.
Current and future holdings are subject to risk.
Investment grade/non-investment grade (high yield) categories and credit ratings breakdowns are based on ratings from agencies such as S&P, which is a private independent rating service that assigns grades to bonds to represent their credit quality. The issues are evaluated based on such factors as the bond issuer’s financial strength and its ability to pay a bond’s principal and interest in a timely fashion. S&P’s ratings are expressed as letters ranging from ‘AAA’, which is the highest grade, to ‘D’, which is the lowest grade. A rating of BBB- or higher is considered investment grade and a rating below BBB- is considered non-investment grade (high yield). Other credit ratings agencies include Moody’s and Fitch, each of whom may have different ratings systems and methodologies.
Performance data quoted represent past performance; past performance does not guarantee future results. The investment return and principal value of an investment will fluctuate so that an investor’s shares, when redeemed, may be worth more or less than their original cost. Current performance of the Fund may be higher or lower than the performance quoted. Performance data current to the most recent month end may be obtained by calling shareholder services toll free at (866) 236-0050.
Investment and insurance products are not FDIC or any other government agency insured, are not bank guaranteed, and may lose value.
A basis point is a unit that is equal to 1/100th of 1%.
Treasuries are securities sold by the federal government to consumers and investors to fund its operations. They are all backed by “the full faith and credit of the United States government” and thus are considered free of default risk.
Yield is the income return on an investment, such as the interest or dividends received from holding a particular security. A yield curve is a graph that plots bond yields vs. maturities, at a set point in time, assuming the bonds have equal credit quality. In the U.S., the yield curve generally refers to that of Treasuries.
The S&P 500 Index is widely regarded as the standard for measuring large cap U.S. stock market performance. The index does not incur expenses, is not available for investment, and includes the reinvestment of dividends.
The Bloomberg U.S. Aggregate Bond Index (Agg) is widely regarded as the standard for measuring U.S. investment grade bond market performance. This index does not incur expenses and is not available for investment. The index includes reinvestment of dividends and/or interest income.
The Bloomberg U.S. Corporate Index includes publicly issued U.S. corporate and specified foreign debentures and secured notes that meet the specified maturity, liquidity, and quality requirements. To qualify, bonds must be SEC-registered. The index includes exclusively corporate sectors, including Industrial, Utility, and Finance, which include both U.S. and non-U.S. corporations.
The Bloomberg U.S. Corporate High Yield Bond Index measures the U.S.D-denominated, high yield, fixed-rate corporate bond market. Securities are classified as high yield if the middle rating of Moody’s, Fitch and S&P is Ba1/BB+/BB+ or below. Bonds from issuers with an emerging markets country of risk, based on Bloomberg EM country definition, are excluded.
Source for any Bloomberg index is Bloomberg Index Services Limited. BLOOMBERG® is a trademark and service mark of Bloomberg Finance L.P. and its affiliates (collectively “Bloomberg”). Bloomberg owns all proprietary rights in the Bloomberg Indices. Bloomberg does not approve or endorse this material, or guarantees the accuracy or completeness of any information herein, or makes any warranty, express or implied, as to the results to be obtained therefrom and, to the maximum extent allowed by law, neither shall have any liability or responsibility for injury or damages arising in connection therewith.
These indices do not incur expenses (unless otherwise noted) and are not available for investment. These indices include reinvestment of dividends and/or interest.
Coupon is the interest rate paid by a bond. The coupon is typically paid semiannually.
Duration measures the sensitivity of a fixed income security’s price to changes in interest rates. Fixed income securities with longer durations generally have more volatile prices than those of comparable quality with shorter durations.
The Chicago Board Options Exchange (CBOE) Volatility Index, or VIX, is a real-time market index that represents the market’s expectation of 30-day forward-looking volatility.
The ICE BofA MOVE Index measures U.S. bond market volatility by tracking a basket of OTC options on U.S. interest rate swaps. The Index tracks implied normal yield volatility of a yield curve weighted basket of at-the-money one month options on the 2-year, 5-year, 10-year, and 30-year constant maturity interest rate swaps.
Effective 6/30/22, the ICE indices reflect transactions costs. Any ICE index data referenced herein is the property of ICE Data Indices, LLC, its affiliates (“ICE Data”) and/or its Third Party Suppliers and has been licensed for use by Osterweis Capital Management. ICE Data and its Third Party Suppliers accept no liability in connection with its use. See https://www.osterweis.com/glossary for a full copy of the Disclaimer.
Capital expenditures (CapEx) are funds used by a company to acquire, upgrade, and maintain physical assets such as property, plants, buildings, technology, or equipment.
Osterweis Capital Management is the adviser to the Osterweis Funds, which are distributed by Quasar Distributors, LLC. [OCMI-816189-2025-10-08]
