Like the title from the Oscar-winning movie, Everything, Everywhere All at Once, the first three months of 2026 featured a mind-boggling confluence of geopolitical and economic events. A partial list includes the arrest and extradition of Venezuela’s President to the United States, further threats regarding Greenland, IEEPA tariffs being overturned by the Supreme Court, AI breakthroughs that triggered massive declines in software equity valuations, continued problems in the private credit market, the four-year anniversary of the Russia/Ukraine conflict, an ongoing DOJ investigation into Fed Chair Jerome Powell, a partial government shutdown of DHS/TSA, and, as if all of that were not enough, a complex and disruptive war with Iran. Still, despite the constant chaos, markets somehow held up relatively well in the first quarter. But beneath the surface, cracks appear to be forming. Markets can discount each event in isolation but absorbing them all at once is another matter. Below we take a closer look at some of the most consequential moments and themes of 2026.
The operation in Venezuela appears to have been an unqualified military success, but thus far the economic impact has been negligible and the longer-term prospects are far from certain. While Venezuela is reputed to have the world’s largest oil reserves, a combination of sanctions, corruption, and lack of investment has caused the amount of Venezuelan oil exported globally to decline rapidly over the last several years. Despite the arrest of Maduro, moves to entice U.S. oil companies to upgrade Venezuelan drilling infrastructure have been met with an icy rebuff. Venezuela’s heavy sour crude is an ideal feedstock for many refineries on the U.S. Gulf Coast, so there clearly is potential to increase future exports. However, estimates by Rystad Energy put the needed investment at $150 billion over the next 10-15 years, which has been a tough sell given the previous losses experienced by U.S. companies in Venezuela and concerns about policy instability. We believe it will be at least a few years before we see a material increase in oil production.
Likewise, although the Supreme Court’s reversal of the IEEPA tariffs was a landmark decision that affirmed the limits of presidential authority, it did little to change the reality on the ground. The first set of Trump tariffs were put in place just under a year ago, and companies have been adjusting and planning based on that framework. If the ruling had its intended effect, we would already be seeing businesses revert to traditional supply chains, but that is not happening. Instead, across-the-board replacement tariffs were immediately announced by the Administration (though they may take longer to implement). This prompted some countries and economic blocs to negotiate new agreements, while others have ceased negotiating until there is more clarity. Regardless, higher tariffs seem to be the new normal and are being priced in by the markets. Companies have been raising prices, and inflation will likely remain well above the Fed’s 2% target. We are keeping an eye out for any further changes.
AI has been another big headline maker over the last 12 months, particularly recently with further advancements in Anthropic’s Claude and Open AI’s ChatGPT. The revenue generated from LLMs to date pales in comparison to the enormous amount of capital being invested to develop them. The chart below shows the CapEx being spent by the major hyperscalers for data centers and the computing infrastructure needed to handle the forecasted growth of AI.
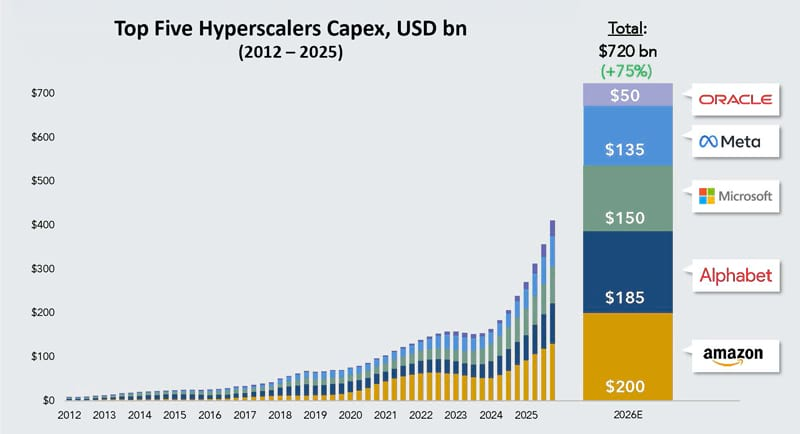
Anecdotally, we have not heard on earnings calls that these companies are achieving large economic returns to date. Granted it is early stages, but returns will need to justify these capital costs. The big concern for us is the funding of this CapEx, which originally relied on equity and free cash flow, but has morphed into massive piles of debt. A significant amount of money has been raised in the investment grade and private credit markets, but billions of dollars have been issued in the convertible and high yield markets as well. Companies like Meta and Microsoft have recently engaged in large, bespoke arrangements with both public and private lenders, which brings new risks to the market that we have been carefully avoiding.
Separately, nobody yet knows whether AI will save money and generate profitable growth for businesses and/or how it will ultimately impact the labor force. Will there be massive layoffs and rising unemployment due to the replacement of workers, as Citrini Research and Dario Amodei, the founder of Anthropic, have hypothesized? Or is it just another efficiency layer built on top of existing systems – a force multiplier that allows workers to be more efficient and increase productivity? Only time will tell, but the turmoil of day-to-day headlines is something investors have to parse.
A related topic that started making regular headlines late last year is the ongoing trouble in the private credit market. As the chart below shows, the asset class has grown extremely rapidly since its inception in 2002.
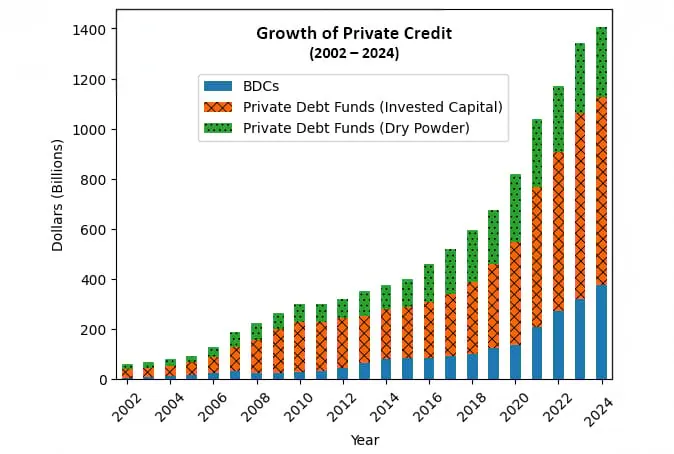
As you might expect, fast growth like this often leads to fast (read: careless) lending, which inevitably leads to credit problems. In fact, there have been many stories in the past several months about private credit borrowers negotiating liability management exercises – a.k.a. distressed exchanges – where lenders are taking the ownership keys from the sponsors due to missed payments or covenant breaches. In some cases, these businesses are struggling badly enough that the new owners even write down their investments shortly after acquiring them. J.P. Morgan High Yield credit strategists estimate that from 2010 to 2023, 50% of distressed exchanges eventually defaulted again. Something to keep an eye on.
Industry concentration is another major risk in private credit. Matt Mish, a Credit Strategist at UBS, estimates that 24% of public Business Development Company (BDC) holdings are in technology and 30% are in business services. For comparison, exposure in the traditional high yield market is 7.3% and 5.7%, respectively. He believes both sectors are disproportionately susceptible to, at a minimum, the perception of AI disruption, and at worst, an existential threat. Prior to the AI boom, software leveraged buyouts (LBOs) were easily able to obtain financing in the BDC, private credit, and leveraged loan markets (deliberately bypassing the high yield market) because they were seen as safe borrowers due to their attractive business models, particularly high switching costs and expanding profit margins.
However, software companies are now seen as highly vulnerable because LLMs like Anthropic’s Claude can develop applications at nearly zero expense, rapidly eroding the competitive advantage that defined the industry for a generation. It is no wonder we have seen a significant uptick in nervous investors trying to withdraw capital from these less liquid vehicles. Many non-publicly traded private credit funds have had to either limit quarterly withdrawals from investors or sell off pieces of their portfolio at discounts to meet redemptions. UBS estimates private credit defaults could reach a high of 15% and leveraged loans 10%, which is significantly higher than the historical default rate for high yield bonds (typically 3%-5%). How long this takes to materialize is a big unknown, but we do know the bankruptcy cycle is often long tailed.
However, we do not believe the troubles in BDCs and private credit funds are a systemic risk for the markets or the banking system, but rather an idiosyncratic risk for investors in those specific funds. One bright spot is that there is very little overlap between the borrowers in the private credit/leveraged loan market and the rest of the high yield market. The withdrawal demand from private credit investors and the forced selling may take several quarters to subside, and it may be several years before we know the true impact of AI disruption on the debt markets and overall economy. This is all part of the growing pains of a relatively new industry.
Finally, and most importantly, on February 28th, the United States and Israel attacked Iran, throwing more chaos into world markets and the global economy. After hitting all-time highs in January and February, the Dow Industrial and S&P Indices are now down on the year. Oil is hovering around $100 per barrel as the Strait of Hormuz is essentially closed. About 20% of the world’s liquified natural gas and 25% of the world’s oil originates in the region and must pass through the Strait. In addition, about one-third of seaborne fertilizer for farming also travels through the Strait. Depending on what crops they grow, farmers could be in planting season just as fertilizer prices are spiking, triggering higher food costs among other unintended consequences.
In times of global uncertainty, demand for U.S. Treasuries usually increases due to the so-called “flight to safety” trade, but during this war, Treasury yields have moved higher as worries about both inflation and excessive borrowing (because of the cost of the conflict) are reducing demand. Pundits have now pivoted away from Fed cuts to the possibility of a rate hike. While it has only been a few weeks, we are already seeing reverberations. Damage to gas and oil infrastructure in neighboring Middle East producers, and subsequent shutdowns of production, could take a long time to recover as chemical plants and oil fields do not turn on overnight. In fact, in some cases, it can take months, or longer, before they can return to full production capacity. United Airlines recently announced a 5% cut in its flight schedule for the second and third quarters due to fuel costs, and the company is estimating that oil could rise to $175/barrel and not return to $100/barrel until the end of 2027. Since the war started, jet fuel prices have almost doubled.
War in the Middle East only adds to the list of concerns the Federal Reserve has to work through. January and February data showed the economy had been neither running too hot nor too cold – sort of a Goldilocks economy. CPI for January and February was relatively benign and showed a minor slowing over the last 12 months but is expected to spike soon due to the war and rise in energy prices. Job openings appear to have risen in January versus December (contrary to the concerns about AI labor disruption) and were also higher than January 2025. Average unemployment claims have been hovering around 210,000 and are not yet showing a longer-term pickup due to announced or anticipated layoffs. As the economists at High Frequency Economics commented, “Claims are well within the recent range over the last two years…There is nothing to worry about in this report.” Payroll data has been slightly more volatile in the last few months, but when averaged out, it has been somewhat listless. Both pending home sales and the National Home Builders survey show slight improvements, while new home sales have been mostly flat. Balancing all this with the added Treasury financing for the war, as well as the existing federal deficits, will be a tough job for the Fed.
In summary, the combination of heightened economic and geopolitical uncertainty feels unprecedented to us, and we have been observing the markets for over three decades. Thus, we are sticking with our defensive posture until some of these crosscurrents resolve themselves. We continue to maintain a healthy amount of liquidity and are comfortable with our duration and portfolio positioning for the current environment.
As always, we thank you for your confidence in our management and we look forward to hearing from you.
Carl Kaufman
CIO – Strategic Income & Managing Director – Fixed Income
Bradley Kane
Vice President & Portfolio Manager – Strategic Income
Craig Manchuck
Vice President & Portfolio Manager – Strategic Income
John Sheehan, CFA
Vice President & Portfolio Manager – Strategic Income
Featuring


Carl Kaufman
CIO – Strategic Income & Managing Director – Fixed Income
Carl Kaufman has managed the Osterweis Strategic Income Fund since its inception and serves as the Managing Director of Fixed Income, as well as a Portfolio Manager for the Osterweis Growth & Income strategy. He is also a member of the firm’s Management Committee.
He joined Osterweis Capital Management in 2002, after nearly 24 years at Robertson Stephens and Merrill Lynch.
Carl graduated from Harvard University and attended New York University Graduate School of Business Administration.
Outside his professional endeavors, he enjoys playing classical piano and actively contributes to the community as a member of the Board of Trustees for the San Francisco Conservatory of Music, supporting the arts and enhancing the cultural fabric of the SF Bay Area. Additionally, he enjoys playing golf, an activity that continually challenges his patience and precision.


Bradley Kane
Vice President & Portfolio Manager – Strategic Income
Bradley (Brad) Kane is a Portfolio Manager for the strategic income strategy and a partner at the firm. In his role he leverages his extensive experience and deep understanding of the market to seek out opportunities to deliver clients attractive risk-adjusted returns.
Prior to joining Osterweis in 2013, Brad was a Portfolio Manager and Analyst at Newfleet Asset Management, where he managed both high yield and leveraged loan portfolios. Before that, he was a Vice President at GSC Partners, focusing on management of high yield and collateralized debt obligations. Earlier in his career, he managed high yield assets as a Vice President at Mitchell Hutchins Asset Management. In these positions he learned the importance of staying focused on one’s investing strategy and discovering new securities and investor types without succumbing to trends.
Brad graduated from Lehigh University with a B.S. in Business & Economics. Outside of his professional life, he enjoys playing golf and ice hockey, as well as indulging in his diverse taste in music, including a particular appreciation for heavy metal.


Craig Manchuck
Vice President & Portfolio Manager – Strategic Income
Craig Manchuck, a partner at Osterweis, is a Portfolio Manager for the strategic income strategy. In this role he enjoys investing clients’ assets in a common sense way that is designed to generate good risk-adjusted returns. Throughout his career, Craig has learned the importance of patience and that relationships with company management teams are invaluable.
Prior to joining Osterweis Capital Management in 2017, Craig was a Managing Director of Fixed Income Sales at Stifel Nicolaus, where he was responsible for sales and origination of high yield bonds, leveraged loans, and post reorg equities. Before Stifel, he held a similar role at Knight Capital. Before that, Craig was the Executive Director for Convertible Securities and then High Yield/Distressed Securities at UBS. He has previous experience in Convertible Securities Sales at Donaldson, Lufkin & Jenrette, SBC Warburg, and Merrill Lynch.
Craig graduated from Lehigh University with a B.S. in Finance and NYU Stern School of Business with an M.B.A. Outside of work, he enjoys golfing, wine, gardening, and spending time with family.


John Sheehan, CFA
Vice President & Portfolio Manager – Strategic Income
John Sheehan, a partner at Osterweis, is a Portfolio Manager for the strategic income strategy. In his role he appreciates the opportunity to contribute to clients feeling confident that their investments are positioned to meet their long-term goals. As a portfolio manager, he likes that the bond market is an ever-evolving game that blends art and science.
Prior to joining the Strategic Income team at the end of 2023, John was a portfolio manager for the total return strategy. Before that, he spent more than 20 years working at Citigroup, first as Managing Director responsible for Investment Grade Syndicate in New York City, where he advised issuers on accessing funding in the corporate bond market. Later at Citigroup, he was Managing Director in charge of West Coast Investment Grade Sales in San Francisco, where he covered several of the largest U.S. investment grade credit investors.
John graduated from Georgetown University with a B.A. in Economics. He holds the CFA designation and is a member of the CFA Society of San Francisco. Outside of work, John enjoys swimming and skiing with his family, as well as seeing live music.
For more information about this strategy, please send us an email or call us at (800) 700-3316.
Related Insights
Strategic Income Fund Quarter-End Performance (as of 6/30/26)
| Fund | 1 MO | QTD | YTD | 1 YR | 3 YR | 5 YR | 7 YR | 10 YR | 15 YR | 20 YR |
INCEP (8/30/2002) |
|
|---|---|---|---|---|---|---|---|---|---|---|---|---|
| OSTIX | 0.15% | 2.37% | 2.28% | 4.48% | 7.58% | 4.55% | 5.12% | 5.27% | 4.88% | 5.59% | 6.14% | |
| Bloomberg U.S. Aggregate Bond Index | 0.24 | 0.67 | 0.62 | 3.79 | 4.16 | 0.08 | 1.22 | 1.54 | 2.28 | 3.32 | 3.35 | |
Gross expense ratio as of 3/31/26: 0.86%
30 Day SEC Yield as of 6/30/26: 4.91%
The SEC yield is calculated with a standardized formula mandated by the SEC. The formula is based on maximum offering price per share. This is also referred to as the “standardized yield,” “30-Day Yield,” or “Current Yield.”
Performance data quoted represent past performance; past performance does not guarantee future results. The investment return and principal value of an investment will fluctuate so that an investor’s shares, when redeemed, may be worth more or less than their original cost. Current performance of the Fund may be higher or lower than the performance quoted. Performance data current to the most recent month end may be obtained by calling shareholder services toll free at (866) 236-0050.
Rates of return for periods greater than one year are annualized.
Where applicable, charts illustrating the performance of a hypothetical $10,000 investment made at a Fund’s inception assume the reinvestment of dividends and capital gains, but do not reflect the effect of any applicable sales charge or redemption fees. Such charts do not imply any future performance.
The Bloomberg U.S. Aggregate Bond Index (Agg) is widely regarded as the standard for measuring U.S. investment grade bond market performance. This index does not incur expenses and is not available for investment. The index includes reinvestment of dividends and/or interest income.
Source for any Bloomberg index is Bloomberg Index Services Limited. BLOOMBERG® is a trademark and service mark of Bloomberg Finance L.P. and its affiliates (collectively “Bloomberg”). Bloomberg owns all proprietary rights in the Bloomberg Indices. Bloomberg does not approve or endorse this material, or guarantees the accuracy or completeness of any information herein, or makes any warranty, express or implied, as to the results to be obtained therefrom and, to the maximum extent allowed by law, neither shall have any liability or responsibility for injury or damages arising in connection therewith.
References to specific companies, market sectors, or investment themes herein do not constitute recommendations to buy or sell any particular securities.
There can be no assurance that any specific security, strategy, or product referenced directly or indirectly in this commentary will be profitable in the future or suitable for your financial circumstances. Due to various factors, including changes to market conditions and/or applicable laws, this content may no longer reflect our current advice or opinion. You should not assume any discussion or information contained herein serves as the receipt of, or as a substitute for, personalized investment advice from Osterweis Capital Management.
Complete holdings of all Osterweis mutual funds (“Funds”) are generally available ten business days following quarter end. Holdings and sector allocations may change at any time due to ongoing portfolio management. Fund holdings as of the most recent quarter end are available here: Strategic Income Fund
The Osterweis Funds are available by prospectus only. The Funds’ investment objectives, risks, charges, and expenses must be considered carefully before investing. The summary and statutory prospectuses contain this and other important information about the Funds. You may obtain a summary or statutory prospectus by calling toll free at (866) 236-0050, or by visiting www.osterweis.com/statpro. Please read the prospectus carefully before investing to ensure the Fund is appropriate for your goals and risk tolerance.
Mutual fund investing involves risk. Principal loss is possible.
The Osterweis Strategic Income Fund may invest in debt securities that are un-rated or rated below investment grade. Lower-rated securities may present an increased possibility of default, price volatility or illiquidity compared to higher-rated securities. The Fund may invest in foreign securities, which involve greater volatility and political, economic and currency risks and differences in accounting methods. Investments in debt securities typically decrease in value when interest rates rise. This risk is usually greater for longer-term debt securities. Small- and mid-capitalization companies tend to have limited liquidity and greater price volatility than large-capitalization companies. From time to time, the Fund may have concentrated positions in one or more sectors subjecting the Fund to sector emphasis risk.
Investment and insurance products are not FDIC or any other government agency insured, are not bank guaranteed, and may lose value.
No part of this article may be reproduced in any form, or referred to in any other publication, without the express written permission of Osterweis Capital Management.
This commentary contains the current opinions of the authors as of the date above, which are subject to change at any time, are not guaranteed, and should not be considered investment advice. This commentary has been distributed for informational purposes only and is not a recommendation or offer of any particular security, strategy, or investment product. Information contained herein has been obtained from sources believed to be reliable but is not guaranteed.
Current and future holdings are subject to risk.
As of 3/31/26 the Osterweis Strategic Income Fund did not hold positions in Amazon, Oracle, Alphabet, Microsoft, Meta, OpenAI, or Anthropic.
Investment grade/non-investment grade (high yield) categories and credit ratings breakdowns are based on ratings from agencies such as S&P, which is a private independent rating service that assigns grades to bonds to represent their credit quality. The issues are evaluated based on such factors as the bond issuer’s financial strength and its ability to pay a bond’s principal and interest in a timely fashion. S&P’s ratings are expressed as letters ranging from ‘AAA’, which is the highest grade, to ‘D’, which is the lowest grade. A rating of BBB- or higher is considered investment grade and a rating below BBB- is considered non-investment grade (high yield). Other credit ratings agencies include Moody’s and Fitch, each of whom may have different ratings systems and methodologies.
Yield is the income return on an investment, such as the interest or dividends received from holding a particular security.
Capital expenditures (CapEx) are funds used by a company to acquire, upgrade, and maintain physical assets such as property, plants, buildings, technology, or equipment.
A leveraged buyout (LBO) is the acquisition of another company using a significant amount of borrowed money (bonds or loans) to meet the cost of acquisition. The assets of the company being acquired are often used as collateral for the loans, along with the assets of the acquiring company.
Consumer Price Index (CPI) reflects the weighted average of prices of a basket of consumer goods and services, such as transportation, food, and medical care. There is typically a one-month lag in the measure due to the release schedule from the U.S. Bureau of Labor Statistics.
Free cash flow represents the cash that a company is able to generate after laying out the money required to maintain and expand the company’s asset base. Free cash flow is important because it allows a company to pursue opportunities that enhance shareholder value.
Duration measures the sensitivity of a fixed income security’s price to changes in interest rates. Fixed income securities with longer durations generally have more volatile prices than those of comparable quality with shorter durations.
Treasuries are securities sold by the federal government to consumers and investors to fund its operations. They are all backed by “the full faith and credit of the United States government” and thus are considered free of default risk.
Liability Management Exercises (LMEs) are transactions used by companies ahead of forthcoming maturities to reduce or manage their overall debt burden by way of tender offers (or debt buybacks) and exchange offers, allowing creditors to exchange their existing instruments for instruments with longer dated maturities and/or with other amended terms.
The S&P 500 Index is widely regarded as the standard for measuring large cap U.S. stock market performance. The index does not incur expenses, is not available for investment, and includes the reinvestment of dividends.
The pending home sales index (PHSI) tracks initial contracts for existing home sales.
The NAHB/Wells Fargo Housing Market Index (HMI) is designed to gauge and track the pulse of the single-family housing market.
Residential Housing Sales Report provides national and regional data on the number of new single-family houses sold and for sale.
These indices do not incur expenses (unless otherwise noted) and are not available for investment. The indices include reinvestment of dividends and/or interest.
Osterweis Capital Management is the adviser to the Osterweis Funds, which are distributed by Quasar Distributors, LLC. [OCMI-910093-2026-04-01]
